
Page 236 - Earth's Climate Past and Future
P. 236
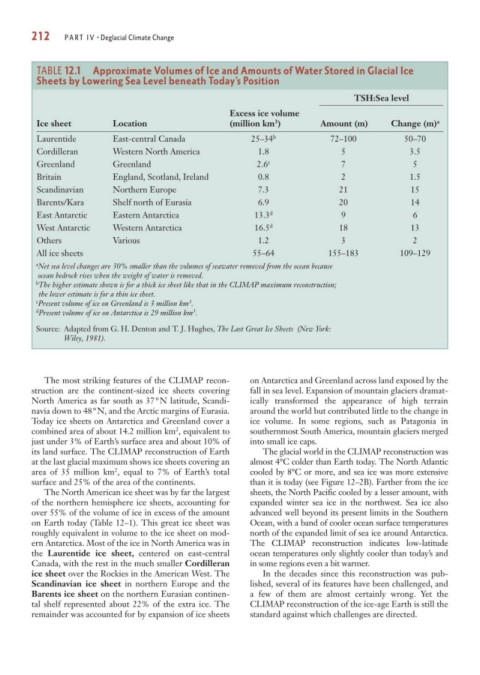
212     PART IV • Deglacial Climate Change


          TABLE 12.1 Approximate Volumes of Ice and Amounts of Water Stored in Glacial Ice
          Sheets by Lowering Sea Level beneath Today’s Position

                                                                                    TSH:Sea level
                                                       Excess ice volume
                                                                  3
          Ice sheet         Location                   (million km )         Amount (m)      Change (m) a
          Laurentide        East-central Canada             25–34 b            72–100           50–70
          Cordilleran       Western North America             1.8                 5               3.5
          Greenland         Greenland                         2.6 c               7               5
          Britain           England, Scotland, Ireland        0.8                 2               1.5
          Scandinavian      Northern Europe                   7.3                21               15
          Barents/Kara      Shelf north of Eurasia            6.9                20               14
          East Antarctic    Eastern Antarctica               13.3 d               9               6
          West Antarctic    Western Antarctica               16.5 d              18               13
          Others            Various                           1.2                 3               2
          All ice sheets                                     55–64            155–183          109–129
         a Net sea level changes are 30% smaller than the volumes of seawater removed from the ocean because
          ocean bedrock rises when the weight of water is removed.
         b The higher estimate shown is for a thick ice sheet like that in the CLIMAP maximum reconstruction;
          the lower estimate is for a thin ice sheet.
                                              3
         c Present volume of ice on Greenland is 3 million km .
                                              3
         d Present volume of ice on Antarctica is 29 million km .
         Source: Adapted from G. H. Denton and T. J. Hughes, The Last Great Ice Sheets  (New York:
                Wiley, 1981).


           The most striking features of the CLIMAP recon-  on Antarctica and Greenland across land exposed by the
        struction are the continent-sized ice sheets covering  fall in sea level. Expansion of mountain glaciers dramat-
        North America as far south as 37°N latitude, Scandi-  ically transformed the appearance of high terrain
        navia down to 48°N, and the Arctic margins of Eurasia.  around the world but contributed little to the change in
        Today ice sheets on Antarctica and Greenland cover a  ice volume. In some regions, such as Patagonia in
                                          2
        combined area of about 14.2 million km , equivalent to  southernmost South America, mountain glaciers merged
        just under 3% of Earth’s surface area and about 10% of  into small ice caps.
        its land surface. The CLIMAP reconstruction of Earth   The glacial world in the CLIMAP reconstruction was
        at the last glacial maximum shows ice sheets covering an  almost 4°C colder than Earth today. The North Atlantic
                            2
        area of 35 million km , equal to 7% of Earth’s total  cooled by 8°C or more, and sea ice was more extensive
        surface and 25% of the area of the continents.      than it is today (see Figure 12–2B). Farther from the ice
           The North American ice sheet was by far the largest  sheets, the North Pacific cooled by a lesser amount, with
        of the northern hemisphere ice sheets, accounting for  expanded winter sea ice in the northwest. Sea ice also
        over 55% of the volume of ice in excess of the amount  advanced well beyond its present limits in the Southern
        on Earth today (Table 12–1). This great ice sheet was  Ocean, with a band of cooler ocean surface temperatures
        roughly equivalent in volume to the ice sheet on mod-  north of the expanded limit of sea ice around Antarctica.
        ern Antarctica. Most of the ice in North America was in  The CLIMAP reconstruction indicates low-latitude
        the  Laurentide ice sheet, centered on east-central  ocean temperatures only slightly cooler than today’s and
        Canada, with the rest in the much smaller Cordilleran  in some regions even a bit warmer.
        ice sheet over the Rockies in the American West. The   In the decades since this reconstruction was pub-
        Scandinavian ice sheet in northern Europe and the   lished, several of its features have been challenged, and
        Barents ice sheet on the northern Eurasian continen-  a few of them are almost certainly wrong. Yet the
        tal shelf represented about 22% of the extra ice. The  CLIMAP reconstruction of the ice-age Earth is still the
        remainder was accounted for by expansion of ice sheets  standard against which challenges are directed.