Page 241 - Earth's Climate Past and Future
P. 241

CHAPTER 12 • Last Glacial Maximum  217


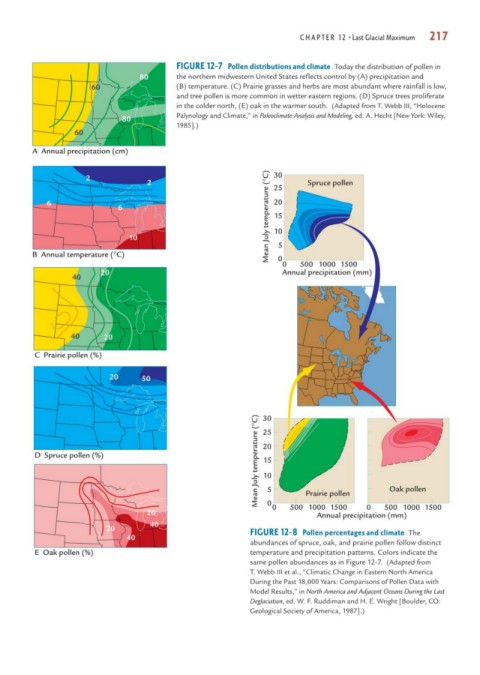
                                           FIGURE 12-7 Pollen distributions and climate Today the distribution of pollen in
                                  80       the northern midwestern United States reflects control by (A) precipitation and
                       60                  (B) temperature. (C) Prairie grasses and herbs are most abundant where rainfall is low,
                                           and tree pollen is more common in wetter eastern regions. (D) Spruce trees proliferate
                                           in the colder north, (E) oak in the warmer south. (Adapted from T. Webb III, “Holocene
                                           Palynology and Climate,” in Paleoclimate Analysis and Modeling, ed. A. Hecht [New York: Wiley,
                              80
                                           1985].)
                  60
         A  Annual precipitation (cm)

                                                                Mean July temperature (°C)  15
                     2                                            30
                                    2                             25      Spruce pollen

            6                                                     20
                             6


                               10                                 10
                                                                   5
         B  Annual temperature (°C)                                0
                                                                    0   500 1000 1500
                         20                                         Annual precipitation (mm)
                  40


                  40     20

         C  Prairie pollen (%)

                           20     50


                                                              Mean July temperature (°C)  10
                                                               25
                                                               20
         D  Spruce pollen (%)                                  30
                                                               15


                                                                                             Oak pollen
                                                                         Prairie pollen
                                                                0
                                    20                          5 0  500 1000 1500     0    500 1000 1500
                                                                            Annual precipitation (mm)
                                    40
                          20                                FIGURE 12-8 Pollen percentages and climate The
                               40
                                                            abundances of spruce, oak, and prairie pollen follow distinct
         E  Oak pollen (%)                                  temperature and precipitation patterns. Colors indicate the
                                                            same pollen abundances as in Figure 12-7. (Adapted from
                                                            T. Webb III et al., “Climatic Change in Eastern North America
                                                            During the Past 18,000 Years: Comparisons of Pollen Data with
                                                            Model Results,” in North America and Adjacent Oceans During the Last
                                                            Deglaciation, ed. W. F. Ruddiman and H. E. Wright [Boulder, CO:
                                                            Geological Society of America, 1987].)
   236   237   238   239   240   241   242   243   244   245   246