
Page 243 - Earth's Climate Past and Future
P. 243
CHAPTER 12 • Last Glacial Maximum 219
tion. The map patterns of pollen abundance estimated
in this way can then be compared directly with the map Arctic Eurasia
patterns derived from pollen counts from lake cores.
For example, observations today show maximum Pacific
amounts of spruce pollen in northeastern Canada
(Figure 12–10A). Counts of pollen in lake sediments
during the last glaciation show spruce concentrated in
the east-central United States just south of the ice sheet
(Figure 12–10B). These analyses agree fairly well with
climate model simulations of where spruce should have Atlantic
occurred at the glacial maximum (Figure 12–10C). A Modern winters
Comparisons with pollen data can also be made with
biome models. To estimate the vegetation that would
have been present in different regions, the biome method
again makes use of climatic variables simulated by GCMs
for times in the past when boundary conditions differed
from those today. The first step in the method uses broad
temperature and precipitation constraints to narrow
the possible range of major vegetation types (for exam-
ple, no trees can occur in model grid boxes for which
hyperarid climates are simulated, but grass and desert
scrub vegetation can).
In the second step, the surviving vegetation units B Glacial winters
within each grid box compete for the resources necessary Sea ice Surface winds
for growth and reproduction, such as water, nutrients, Ice sheets Jet stream
and light. Both steps are based on today’s relationships
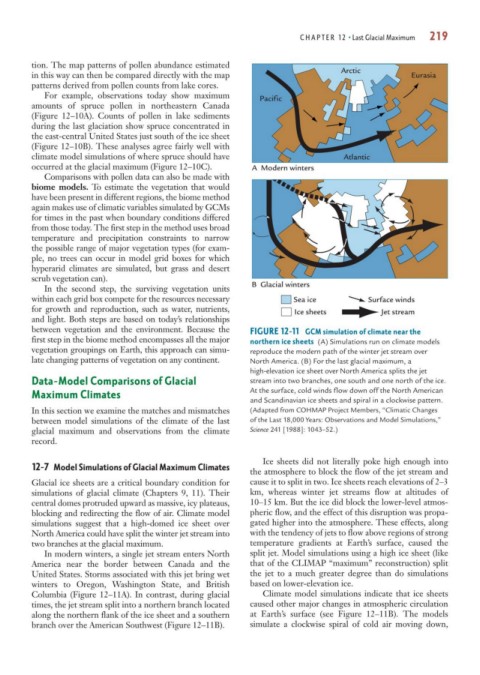
between vegetation and the environment. Because the FIGURE 12-11 GCM simulation of climate near the
first step in the biome method encompasses all the major northern ice sheets (A) Simulations run on climate models
vegetation groupings on Earth, this approach can simu- reproduce the modern path of the winter jet stream over
late changing patterns of vegetation on any continent. North America. (B) For the last glacial maximum, a
high-elevation ice sheet over North America splits the jet
Data-Model Comparisons of Glacial stream into two branches, one south and one north of the ice.
Maximum Climates At the surface, cold winds flow down off the North American
and Scandinavian ice sheets and spiral in a clockwise pattern.
In this section we examine the matches and mismatches (Adapted from COHMAP Project Members, “Climatic Changes
between model simulations of the climate of the last of the Last 18,000 Years: Observations and Model Simulations,”
glacial maximum and observations from the climate Science 241 [1988]: 1043–52.)
record.
Ice sheets did not literally poke high enough into
12-7 Model Simulations of Glacial Maximum Climates
the atmosphere to block the flow of the jet stream and
Glacial ice sheets are a critical boundary condition for cause it to split in two. Ice sheets reach elevations of 2–3
simulations of glacial climate (Chapters 9, 11). Their km, whereas winter jet streams flow at altitudes of
central domes protruded upward as massive, icy plateaus, 10–15 km. But the ice did block the lower-level atmos-
blocking and redirecting the flow of air. Climate model pheric flow, and the effect of this disruption was propa-
simulations suggest that a high-domed ice sheet over gated higher into the atmosphere. These effects, along
North America could have split the winter jet stream into with the tendency of jets to flow above regions of strong
two branches at the glacial maximum. temperature gradients at Earth’s surface, caused the
In modern winters, a single jet stream enters North split jet. Model simulations using a high ice sheet (like
America near the border between Canada and the that of the CLIMAP “maximum” reconstruction) split
United States. Storms associated with this jet bring wet the jet to a much greater degree than do simulations
winters to Oregon, Washington State, and British based on lower-elevation ice.
Columbia (Figure 12–11A). In contrast, during glacial Climate model simulations indicate that ice sheets
times, the jet stream split into a northern branch located caused other major changes in atmospheric circulation
along the northern flank of the ice sheet and a southern at Earth’s surface (see Figure 12–11B). The models
branch over the American Southwest (Figure 12–11B). simulate a clockwise spiral of cold air moving down,