
Page 248 - Earth's Climate Past and Future
P. 248
224 PART IV • Deglacial Climate Change
forest vegetation. The increase in rain forest in this
region may have offset the loss of biomass elsewhere in
Africa
the tropics, but it could not offset the enormous decrease
Winter sea ice in forest biomass at high northern latitudes. As a result,
(glacial; CLIMAP)
the total glacial biomass on Earth’s continents was about
Winter sea ice 25% lower than it is today (Chapter 10).
(modern)
South How Cold Were the Glacial Tropics?
America
Antarctica For almost two decades climate scientists have argued
about the amount of temperature change in the tropics
and subtropics. Tropical sea-surface temperatures
reconstructed by CLIMAP on the basis of fossil shells
of ocean plankton averaged just 1°–2°C cooler than
they are today, and in some regions such as the subtrop-
Australia ical Pacific the ocean was estimated to have been more
than 1°C warmer.
New Zealand In contrast, other evidence suggests that tempera-
tures over tropical landmasses and parts of the tropical
ocean may have been 4°–6°C cooler than at present,
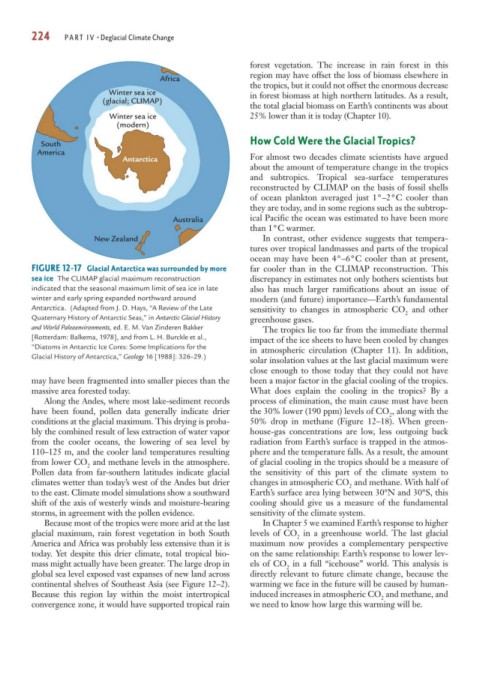
FIGURE 12-17 Glacial Antarctica was surrounded by more far cooler than in the CLIMAP reconstruction. This
sea ice The CLIMAP glacial maximum reconstruction discrepancy in estimates not only bothers scientists but
indicated that the seasonal maximum limit of sea ice in late also has much larger ramifications about an issue of
winter and early spring expanded northward around modern (and future) importance—Earth’s fundamental
Antarctica. (Adapted from J. D. Hays, “A Review of the Late sensitivity to changes in atmospheric CO and other
Quaternary History of Antarctic Seas,” in Antarctic Glacial History greenhouse gases. 2
and World Paleoenvironments, ed. E. M. Van Zinderen Bakker The tropics lie too far from the immediate thermal
[Rotterdam: Balkema, 1978], and from L. H. Burckle et al.,
impact of the ice sheets to have been cooled by changes
“Diatoms in Antarctic Ice Cores: Some Implications for the in atmospheric circulation (Chapter 11). In addition,
Glacial History of Antarctica,” Geology 16 [1988]: 326–29.)
solar insolation values at the last glacial maximum were
close enough to those today that they could not have
may have been fragmented into smaller pieces than the been a major factor in the glacial cooling of the tropics.
massive area forested today. What does explain the cooling in the tropics? By a
Along the Andes, where most lake-sediment records process of elimination, the main cause must have been
have been found, pollen data generally indicate drier the 30% lower (190 ppm) levels of CO , along with the
2
conditions at the glacial maximum. This drying is proba- 50% drop in methane (Figure 12–18). When green-
bly the combined result of less extraction of water vapor house-gas concentrations are low, less outgoing back
from the cooler oceans, the lowering of sea level by radiation from Earth’s surface is trapped in the atmos-
110–125 m, and the cooler land temperatures resulting phere and the temperature falls. As a result, the amount
from lower CO and methane levels in the atmosphere. of glacial cooling in the tropics should be a measure of
2
Pollen data from far-southern latitudes indicate glacial the sensitivity of this part of the climate system to
climates wetter than today’s west of the Andes but drier changes in atmospheric CO and methane. With half of
2
to the east. Climate model simulations show a southward Earth’s surface area lying between 30°N and 30°S, this
shift of the axis of westerly winds and moisture-bearing cooling should give us a measure of the fundamental
storms, in agreement with the pollen evidence. sensitivity of the climate system.
Because most of the tropics were more arid at the last In Chapter 5 we examined Earth’s response to higher
glacial maximum, rain forest vegetation in both South levels of CO in a greenhouse world. The last glacial
2
America and Africa was probably less extensive than it is maximum now provides a complementary perspective
today. Yet despite this drier climate, total tropical bio- on the same relationship: Earth’s response to lower lev-
mass might actually have been greater. The large drop in els of CO in a full “icehouse” world. This analysis is
2
global sea level exposed vast expanses of new land across directly relevant to future climate change, because the
continental shelves of Southeast Asia (see Figure 12–2). warming we face in the future will be caused by human-
Because this region lay within the moist intertropical induced increases in atmospheric CO and methane, and
2
convergence zone, it would have supported tropical rain we need to know how large this warming will be.