
Page 240 - Earth's Climate Past and Future
P. 240
216 PART IV • Deglacial Climate Change
Testing Model Simulations against The COHMAP researchers then ran model simula-
Biotic Data tions of climate at intervals of several thousand years
between the glacial maximum and the present to deter-
So far, we have examined only the physical aspects (ice mine how changes in the major boundary conditions
and dirt) of the glacial maximum world. But living drove regional patterns of climate change. The
organisms also have a story to tell. They also allow us to COHMAP team focused on the role of orbital-scale
test the performance of climate models on a world quite changes in climate over intervals of thousands of years,
different from ours. rather than on shorter-term fluctuations superimposed
on this gradual trend.
12-4 COHMAP: Data-Model Comparisons The climate data produced as output from these
model simulations were then tested against climate
During the 1980s, an interdisciplinary project called reconstructions using C-dated records of pollen from
14
COHMAP (Cooperative Holocene Mapping Project) lake cores and plankton shells from ocean sediment
used a combined data-model approach to examine the cores. Modern relationships between the abundances of
last glacial maximum and the subsequent changes to species and climatic variables can be measured, quanti-
interglacial conditions. Led by the meteorologists John fied, and used to reconstruct past climates from fossil
Kutzbach and Tom Webb, the paleoecologist Herb organisms. By comparing these fossil-based estimates of
Wright, and the geographer Alayne Street-Perrott, climate with the changes simulated by the models,
COHMAP brought together scientists from countries scientists can test the reliability of both approaches (see
around the world to pool information from hundreds of Figure 12–6).
individual C-dated records of lake levels and pollen
14
in lake sediments for the purpose of examining regional-
scale patterns. 12-5 Pollen: An Indicator of Climate on the
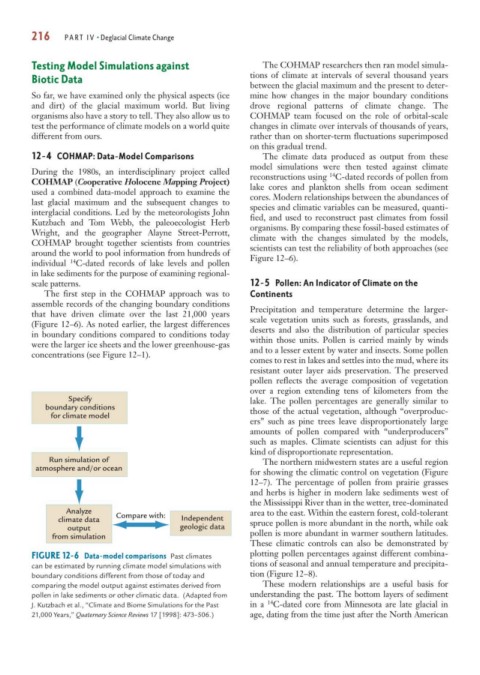
The first step in the COHMAP approach was to Continents
assemble records of the changing boundary conditions
that have driven climate over the last 21,000 years Precipitation and temperature determine the larger-
(Figure 12–6). As noted earlier, the largest differences scale vegetation units such as forests, grasslands, and
in boundary conditions compared to conditions today deserts and also the distribution of particular species
were the larger ice sheets and the lower greenhouse-gas within those units. Pollen is carried mainly by winds
concentrations (see Figure 12–1). and to a lesser extent by water and insects. Some pollen
comes to rest in lakes and settles into the mud, where its
resistant outer layer aids preservation. The preserved
pollen reflects the average composition of vegetation
over a region extending tens of kilometers from the
Specify lake. The pollen percentages are generally similar to
boundary conditions those of the actual vegetation, although “overproduc-
for climate model
ers” such as pine trees leave disproportionately large
amounts of pollen compared with “underproducers”
such as maples. Climate scientists can adjust for this
kind of disproportionate representation.
Run simulation of The northern midwestern states are a useful region
atmosphere and/or ocean
for showing the climatic control on vegetation (Figure
12–7). The percentage of pollen from prairie grasses
and herbs is higher in modern lake sediments west of
the Mississippi River than in the wetter, tree-dominated
Analyze area to the east. Within the eastern forest, cold-tolerant
climate data Compare with: Independent spruce pollen is more abundant in the north, while oak
output geologic data
from simulation pollen is more abundant in warmer southern latitudes.
These climatic controls can also be demonstrated by
FIGURE 12-6 Data-model comparisons Past climates plotting pollen percentages against different combina-
can be estimated by running climate model simulations with tions of seasonal and annual temperature and precipita-
boundary conditions different from those of today and tion (Figure 12–8).
comparing the model output against estimates derived from These modern relationships are a useful basis for
pollen in lake sediments or other climatic data. (Adapted from understanding the past. The bottom layers of sediment
14
J. Kutzbach et al., “Climate and Biome Simulations for the Past in a C-dated core from Minnesota are late glacial in
21,000 Years,” Quaternary Science Reviews 17 [1998]: 473–506.) age, dating from the time just after the North American