
Page 242 - Earth's Climate Past and Future
P. 242
218 PART IV • Deglacial Climate Change
Minnesota lake sediment core 14 C ages pollen to warm-tolerant oak pollen near 10,000 years ago
0 (years) indicates rapid warming in this region. Subsequently,
changes to maximum values of dry-adapted herb and
1660 grass pollen indicate a climate drier than today’s.
2 The Minnesota core is one of many hundreds exam-
ined in North America, along with additional hundreds
in Europe and elsewhere in the world (see Chapter 2).
Depth in core (m) 6 5450 Viewed together, these records provide a larger geo-
4
graphic perspective on the pattern of pollen (and vegeta-
tion) distribution at the last glacial maximum and during
the deglaciation. This larger map perspective can be com-
pared with map patterns produced by model simulations.
7120
8
10 10,230 12-6 Using Pollen for Data-Model Comparisons
Data-model comparisons focus on the distribution of
13,270 pollen at specific intervals in the past across geographic
0 20 40 60 0 20 40 60 0 20 40
Spruce pollen Oak pollen Prairie pollen regions. Counts of pollen percentages in lake sediments
(%) (%) (%) within these regions produce mapped patterns of
“observed” pollen abundance. These observed patterns
14
FIGURE 12-9 Pollen in a lake core A C-dated sediment are then compared with pollen distributions simulated
core from a Minnesota lake shows a transition in climate near by climate models for the same interval in the past.
10,000 years ago from colder conditions (abundant spruce) to These model-simulated pollen distributions are the
a warmer climate (abundant oak). High percentages of prairie result of several steps. First, boundary conditions are
grasses near 6000 years ago indicate a drier climate. (Adapted chosen and used in model simulations that yield esti-
from H. E. Wright et al., “Two Pollen Diagrams from Southeastern mates of past temperature and precipitation. Then the
Minnesota: Problems in the Late- and Postglacial Vegetation
model estimates of temperature and precipitation are
History,” Geological Society of America Bulletin 74 [1963]: 1371–96.)
used to generate estimates of the percentage abundance
of each type of pollen based on the modern relationship
ice sheet melted back from this region, whereas the between climate and pollen (for example, see Figure
upper layers of mud record the postglacial climate of the 12–8). Each estimate of annual precipitation and mean
present interglaciation (Figure 12–9). Most of the pollen July temperature simulated for a specific grid box in the
in the older layers is from spruce trees, indicating condi- model yields a specific estimate of the percentage of
tions colder than today’s. An abrupt switch from spruce oak, spruce, and prairie pollen for that particular loca-
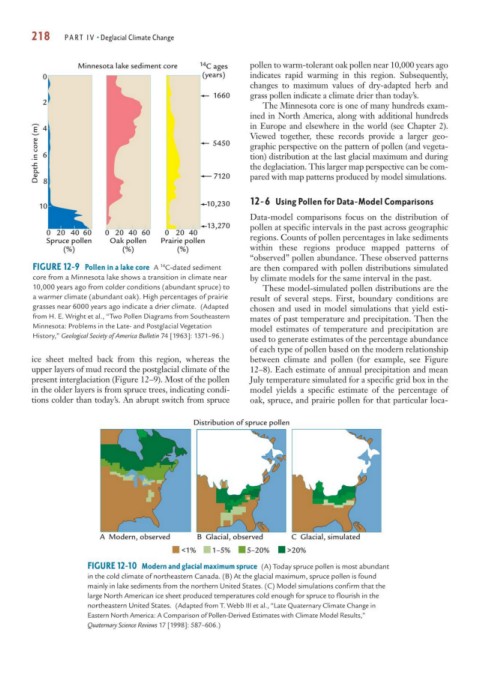
Distribution of spruce pollen
A Modern, observed B Glacial, observed C Glacial, simulated
<1% 1–5% 5–20% >20%
FIGURE 12-10 Modern and glacial maximum spruce (A) Today spruce pollen is most abundant
in the cold climate of northeastern Canada. (B) At the glacial maximum, spruce pollen is found
mainly in lake sediments from the northern United States. (C) Model simulations confirm that the
large North American ice sheet produced temperatures cold enough for spruce to flourish in the
northeastern United States. (Adapted from T. Webb III et al., “Late Quaternary Climate Change in
Eastern North America: A Comparison of Pollen-Derived Estimates with Climate Model Results,”
Quaternary Science Reviews 17 [1998]: 587–606.)