
Page 370 - Earth's Climate Past and Future
P. 370
346 PART V • Historical and Future Climate Change
Antarctic ice cores shows that CO values have not risen
2
1200 above 300 ppm for at least the last 760,000 years. By
??
4 × CO some estimates, concentrations as high as 550 ppm have
2 ?? ?? not existed since 5 to 20 million years ago, and concen-
Atmospheric CO 2 (ppm) 800 ? ? ?? ?? ?? millions of years, possibly since the Cretaceous green-
1000
trations as high as 1200 ppm have not existed for tens of
house world.
The projected trends of CO concentration (see
2
Figure 19–3) reach their peak values later than the pro-
600
jected CO emissions trends (see Figure 19–2) and then
2
this delay is the slow rate of CO removal by the ocean.
400 2 × CO 2 ? ?? ?? ?? ?? remain at high levels for a long time. The reason for
2
Current
Although individual CO molecules move back and forth
2
1 × CO (Preindustrial) between the air and the surface ocean within a few years,
2
200 it takes many centuries for the ocean to absorb most of
1800 1900 2000 2100 2200 2300 2400 the excess CO emitted by humans (Figure 19–4A), and
2200
Year 2
the remaining 10% will stay in the atmosphere for
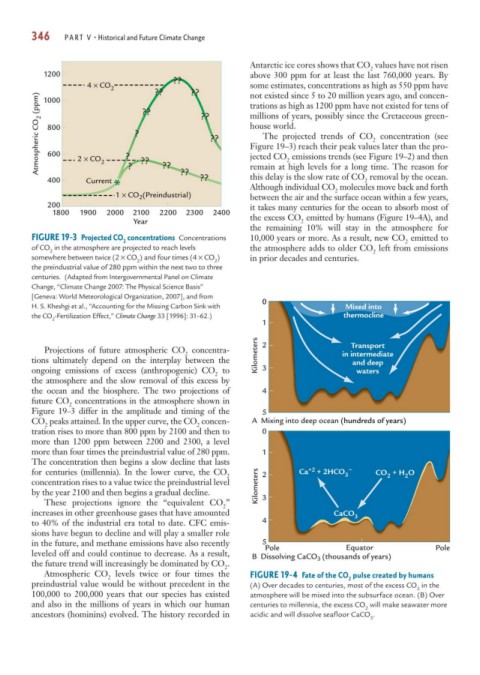
FIGURE 19-3 Projected CO concentrations Concentrations 10,000 years or more. As a result, new CO emitted to
2 2
of CO in the atmosphere are projected to reach levels the atmosphere adds to older CO left from emissions
2 2
somewhere between twice (2 × CO ) and four times (4 × CO ) in prior decades and centuries.
2
2
the preindustrial value of 280 ppm within the next two to three
centuries. (Adapted from Intergovernmental Panel on Climate
Change, “Climate Change 2007: The Physical Science Basis”
[Geneva: World Meteorological Organization, 2007], and from
0 0
H. S. Kheshgi et al., “Accounting for the Missing Carbon Sink with Mixed into
the CO -Fertilization Effect,” Climate Change 33 [1996]: 31–62.) thermocline
2
1
Projections of future atmospheric CO concentra- 2 Transport
2 Kilometers in intermediate
tions ultimately depend on the interplay between the and deep
ongoing emissions of excess (anthropogenic) CO to 3 waters
2
the atmosphere and the slow removal of this excess by
the ocean and the biosphere. The two projections of 4
future CO concentrations in the atmosphere shown in
2
Figure 19–3 differ in the amplitude and timing of the 5
CO peaks attained. In the upper curve, the CO concen- A Mixing into deep ocean (hundreds of years)
2 2
tration rises to more than 800 ppm by 2100 and then to 0
more than 1200 ppm between 2200 and 2300, a level
more than four times the preindustrial value of 280 ppm. 1
The concentration then begins a slow decline that lasts
for centuries (millennia). In the lower curve, the CO Ca +2 + 2HCO – CO + H O
2 2 3 2 2
concentration rises to a value twice the preindustrial level Kilometers
by the year 2100 and then begins a gradual decline. 3
These projections ignore the “equivalent CO ”
2
increases in other greenhouse gases that have amounted CaCO 3
to 40% of the industrial era total to date. CFC emis- 4
sions have begun to decline and will play a smaller role
in the future, and methane emissions have also recently 5
Pole Equator Pole
leveled off and could continue to decrease. As a result,
B Dissolving CaCO (thousands of years)
3
the future trend will increasingly be dominated by CO .
2
Atmospheric CO levels twice or four times the FIGURE 19-4 Fate of the CO pulse created by humans
2 2
preindustrial value would be without precedent in the (A) Over decades to centuries, most of the excess CO in the
2
100,000 to 200,000 years that our species has existed atmosphere will be mixed into the subsurface ocean. (B) Over
and also in the millions of years in which our human centuries to millennia, the excess CO will make seawater more
2
ancestors (hominins) evolved. The history recorded in acidic and will dissolve seafloor CaCO .
3