
Page 369 - Earth's Climate Past and Future
P. 369
CHAPTER 19 • Future Climatic Change 345
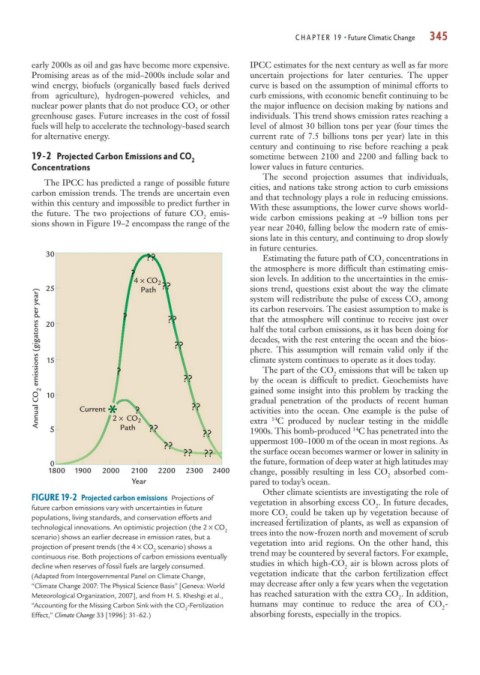
early 2000s as oil and gas have become more expensive. IPCC estimates for the next century as well as far more
Promising areas as of the mid–2000s include solar and uncertain projections for later centuries. The upper
wind energy, biofuels (organically based fuels derived curve is based on the assumption of minimal efforts to
from agriculture), hydrogen-powered vehicles, and curb emissions, with economic benefit continuing to be
nuclear power plants that do not produce CO or other the major influence on decision making by nations and
2
greenhouse gases. Future increases in the cost of fossil individuals. This trend shows emission rates reaching a
fuels will help to accelerate the technology-based search level of almost 30 billion tons per year (four times the
for alternative energy. current rate of 7.5 billions tons per year) late in this
century and continuing to rise before reaching a peak
19-2 Projected Carbon Emissions and CO sometime between 2100 and 2200 and falling back to
2
Concentrations lower values in future centuries.
The second projection assumes that individuals,
The IPCC has predicted a range of possible future cities, and nations take strong action to curb emissions
carbon emission trends. The trends are uncertain even and that technology plays a role in reducing emissions.
within this century and impossible to predict further in With these assumptions, the lower curve shows world-
the future. The two projections of future CO emis-
2 wide carbon emissions peaking at ~9 billion tons per
sions shown in Figure 19–2 encompass the range of the
year near 2040, falling below the modern rate of emis-
sions late in this century, and continuing to drop slowly
in future centuries.
30
?? Estimating the future path of CO concentrations in
2
the atmosphere is more difficult than estimating emis-
?
4 × CO ?? ?? sion levels. In addition to the uncertainties in the emis-
2
sions trend, questions exist about the way the climate
25
Path
Annual CO 2 emissions (gigatons per year) 20 ? ?? ?? half the total carbon emissions, as it has been doing for
system will redistribute the pulse of excess CO among
2
its carbon reservoirs. The easiest assumption to make is
?
that the atmosphere will continue to receive just over
decades, with the rest entering the ocean and the bios-
phere. This assumption will remain valid only if the
climate system continues to operate as it does today.
15
The part of the CO emissions that will be taken up
2
by the ocean is difficult to predict. Geochemists have
gained some insight into this problem by tracking the
10
?
activities into the ocean. One example is the pulse of
extra C produced by nuclear testing in the middle
14
2
Path
5 Current 2 × CO ?? ?? gradual penetration of the products of recent human
14
1900s. This bomb-produced C has penetrated into the
??
?? uppermost 100–1000 m of the ocean in most regions. As
?? ?? the surface ocean becomes warmer or lower in salinity in
0 the future, formation of deep water at high latitudes may
1800 1900 2000 2100 2200 2300 2400 change, possibly resulting in less CO absorbed com-
2
Year pared to today’s ocean.
Other climate scientists are investigating the role of
FIGURE 19-2 Projected carbon emissions Projections of vegetation in absorbing excess CO . In future decades,
2
future carbon emissions vary with uncertainties in future more CO could be taken up by vegetation because of
2
populations, living standards, and conservation efforts and increased fertilization of plants, as well as expansion of
technological innovations. An optimistic projection (the 2 × CO
2 trees into the now-frozen north and movement of scrub
scenario) shows an earlier decrease in emission rates, but a
projection of present trends (the 4 × CO scenario) shows a vegetation into arid regions. On the other hand, this
2 trend may be countered by several factors. For example,
continuous rise. Both projections of carbon emissions eventually
decline when reserves of fossil fuels are largely consumed. studies in which high-CO air is blown across plots of
2
(Adapted from Intergovernmental Panel on Climate Change, vegetation indicate that the carbon fertilization effect
“Climate Change 2007: The Physical Science Basis” [Geneva: World may decrease after only a few years when the vegetation
Meteorological Organization, 2007], and from H. S. Kheshgi et al., has reached saturation with the extra CO . In addition,
2
“Accounting for the Missing Carbon Sink with the CO -Fertilization humans may continue to reduce the area of CO -
2
2
Effect,” Climate Change 33 [1996]: 31–62.) absorbing forests, especially in the tropics.