
Page 364 - Earth's Climate Past and Future
P. 364
340 PART V • Historical and Future Climate Change
Higher fast-responding Warmer
Reaction of
parts of
Excess climate system
CO 2
pulse
Reaction of
slow-responding Total
parts of warming
climate system increase
CO
Temperature
2
CO 2 Delayed
1800 2000 2500 3000 warming
Year
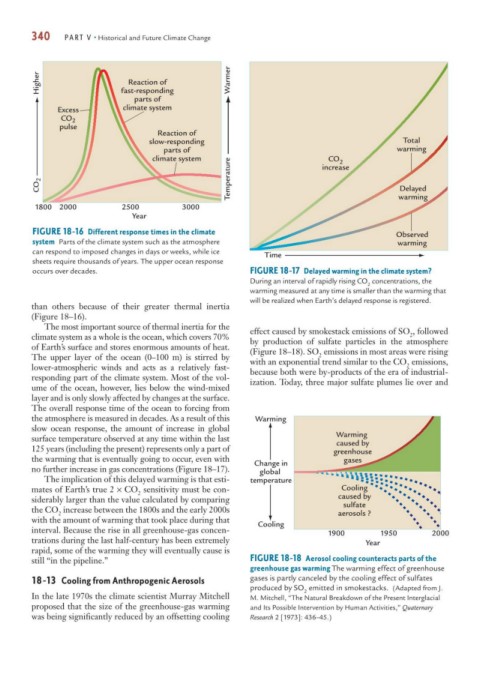
FIGURE 18-16 Different response times in the climate Observed
system Parts of the climate system such as the atmosphere warming
can respond to imposed changes in days or weeks, while ice
Time
sheets require thousands of years. The upper ocean response
occurs over decades. FIGURE 18-17 Delayed warming in the climate system?
During an interval of rapidly rising CO concentrations, the
2
warming measured at any time is smaller than the warming that
will be realized when Earth’s delayed response is registered.
than others because of their greater thermal inertia
(Figure 18–16).
The most important source of thermal inertia for the
2
climate system as a whole is the ocean, which covers 70% effect caused by smokestack emissions of SO , followed
by production of sulfate particles in the atmosphere
of Earth’s surface and stores enormous amounts of heat. (Figure 18–18). SO emissions in most areas were rising
The upper layer of the ocean (0–100 m) is stirred by with an exponential trend similar to the CO emissions,
2
lower-atmospheric winds and acts as a relatively fast- because both were by-products of the era of industrial-
2
responding part of the climate system. Most of the vol- ization. Today, three major sulfate plumes lie over and
ume of the ocean, however, lies below the wind-mixed
layer and is only slowly affected by changes at the surface.
The overall response time of the ocean to forcing from
the atmosphere is measured in decades. As a result of this Warming
slow ocean response, the amount of increase in global
surface temperature observed at any time within the last Warming
caused by
125 years (including the present) represents only a part of greenhouse
the warming that is eventually going to occur, even with Change in gases
no further increase in gas concentrations (Figure 18–17). global
The implication of this delayed warming is that esti- temperature
mates of Earth’s true 2 × CO sensitivity must be con- Cooling
2
siderably larger than the value calculated by comparing caused by
the CO increase between the 1800s and the early 2000s sulfate
2 aerosols ?
with the amount of warming that took place during that Cooling
interval. Because the rise in all greenhouse-gas concen- 1900 1950 2000
trations during the last half-century has been extremely Year
rapid, some of the warming they will eventually cause is
still “in the pipeline.” FIGURE 18-18 Aerosol cooling counteracts parts of the
greenhouse gas warming The warming effect of greenhouse
18-13 Cooling from Anthropogenic Aerosols gases is partly canceled by the cooling effect of sulfates
produced by SO emitted in smokestacks. (Adapted from J.
2
In the late 1970s the climate scientist Murray Mitchell M. Mitchell, “The Natural Breakdown of the Present Interglacial
proposed that the size of the greenhouse-gas warming and Its Possible Intervention by Human Activities,” Quaternary
was being significantly reduced by an offsetting cooling Research 2 [1973]: 436–45.)