
Page 361 - Earth's Climate Past and Future
P. 361
CHAPTER 18 • Causes of Warming over the Last 125 Years 337
BOX 18-1 CLIMATE INTERACTIONS AND FEEDBACKS
CONTINUED
2
Because 2.7 W/m represents a 1.8% addition to the (see Figure 18–13). For a mid-range estimate of 2.5°C for the
2
natural greenhouse effect of 150 W/m , it is referred to as an climate system sensitivity to a CO doubling, the industrial-
2
2
enhanced greenhouse effect. In response to this anthro- era radiative forcing of 2.7 W/m can be converted to an
pogenic enhancement, Earth’s surface and lower atmos- equilibrium temperature response by multiplying it by the
2
phere have warmed, and the atmosphere now radiates climate-system sensitivity of 0.625°C/W/m ). According to
additional heat to space to compensate for the warming. this calculation, Earth’s climate would have warmed by 1.7°C
When the climate system has time to reach an equi- (2.7 × 0.625) during the industrial era if it had reached
librium temperature response to an initial change in radia- full equilibrium with the greenhouse-gas concentration in
tive forcing, the amount of warming depends both on the 2006. Because the climate system has a response time of
increase in radiative forcing and on the sensitivity of the cli- several decades, however, it has not responded fully to
mate system, which is only known within rather broad limits greenhouse gases added during recent decades.
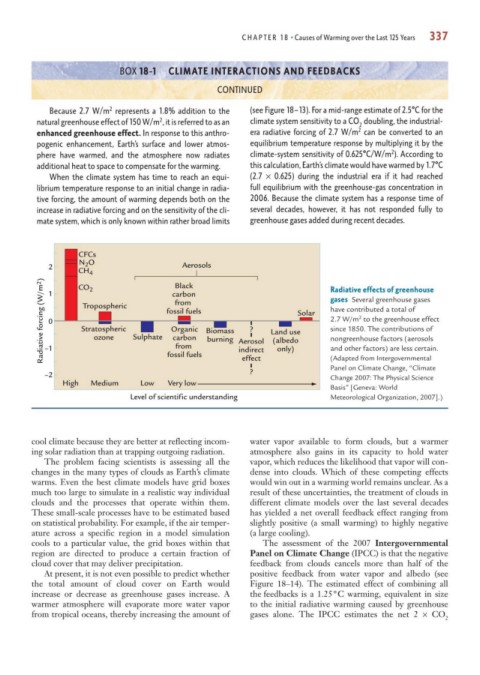
CFCs
2 N 2 O Aerosols
CH 4 2 carbon Radiative effects of greenhouse
Radiative forcing (W/m 2 ) 0 Stratospheric Sulphate fossil fuels Biomass Aerosol Land use Solar gases Several greenhouse gases
Black
CO
1
from
Tropospheric
have contributed a total of
2
2.7 W/m to the greenhouse effect
since 1850. The contributions of
Organic
?
ozone
carbon
nongreenhouse factors (aerosols
burning
(albedo
from
–1
and other factors) are less certain.
only)
indirect
fossil fuels
(Adapted from Intergovernmental
effect
Panel on Climate Change, “Climate
?
–2 Change 2007: The Physical Science
High Medium Low Very low
Basis” [Geneva: World
Level of scientific understanding Meteorological Organization, 2007].)
cool climate because they are better at reflecting incom- water vapor available to form clouds, but a warmer
ing solar radiation than at trapping outgoing radiation. atmosphere also gains in its capacity to hold water
The problem facing scientists is assessing all the vapor, which reduces the likelihood that vapor will con-
changes in the many types of clouds as Earth’s climate dense into clouds. Which of these competing effects
warms. Even the best climate models have grid boxes would win out in a warming world remains unclear. As a
much too large to simulate in a realistic way individual result of these uncertainties, the treatment of clouds in
clouds and the processes that operate within them. different climate models over the last several decades
These small-scale processes have to be estimated based has yielded a net overall feedback effect ranging from
on statistical probability. For example, if the air temper- slightly positive (a small warming) to highly negative
ature across a specific region in a model simulation (a large cooling).
cools to a particular value, the grid boxes within that The assessment of the 2007 Intergovernmental
region are directed to produce a certain fraction of Panel on Climate Change (IPCC) is that the negative
cloud cover that may deliver precipitation. feedback from clouds cancels more than half of the
At present, it is not even possible to predict whether positive feedback from water vapor and albedo (see
the total amount of cloud cover on Earth would Figure 18–14). The estimated effect of combining all
increase or decrease as greenhouse gases increase. A the feedbacks is a 1.25°C warming, equivalent in size
warmer atmosphere will evaporate more water vapor to the initial radiative warming caused by greenhouse
from tropical oceans, thereby increasing the amount of gases alone. The IPCC estimates the net 2 × CO
2