
Page 362 - Earth's Climate Past and Future
P. 362
338 PART V • Historical and Future Climate Change
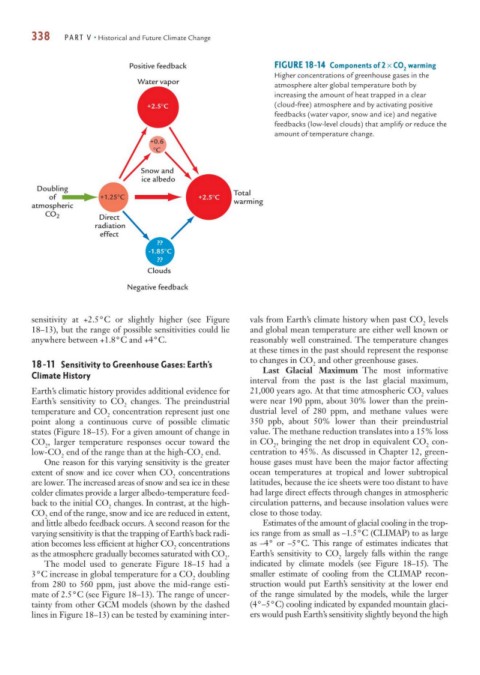
Positive feedback FIGURE 18-14 Components of 2 × CO warming
2
Higher concentrations of greenhouse gases in the
Water vapor
atmosphere alter global temperature both by
increasing the amount of heat trapped in a clear
+2.5°C (cloud-free) atmosphere and by activating positive
feedbacks (water vapor, snow and ice) and negative
feedbacks (low-level clouds) that amplify or reduce the
amount of temperature change.
+0.6
°C
Snow and
ice albedo
Doubling
of +1.25°C +2.5°C Total
atmospheric warming
CO 2 Direct
radiation
effect
??
-1.85°C
??
Clouds
Negative feedback
sensitivity at +2.5°C or slightly higher (see Figure vals from Earth’s climate history when past CO levels
2
18–13), but the range of possible sensitivities could lie and global mean temperature are either well known or
anywhere between +1.8°C and +4°C. reasonably well constrained. The temperature changes
at these times in the past should represent the response
to changes in CO and other greenhouse gases.
18-11 Sensitivity to Greenhouse Gases: Earth’s 2
Last Glacial Maximum The most informative
Climate History
interval from the past is the last glacial maximum,
Earth’s climatic history provides additional evidence for 21,000 years ago. At that time atmospheric CO values
2
Earth’s sensitivity to CO changes. The preindustrial were near 190 ppm, about 30% lower than the prein-
2
temperature and CO concentration represent just one dustrial level of 280 ppm, and methane values were
2
point along a continuous curve of possible climatic 350 ppb, about 50% lower than their preindustrial
states (Figure 18–15). For a given amount of change in value. The methane reduction translates into a 15% loss
CO , larger temperature responses occur toward the in CO , bringing the net drop in equivalent CO con-
2 2 2
low-CO end of the range than at the high-CO end. centration to 45%. As discussed in Chapter 12, green-
2 2
One reason for this varying sensitivity is the greater house gases must have been the major factor affecting
extent of snow and ice cover when CO concentrations ocean temperatures at tropical and lower subtropical
2
are lower. The increased areas of snow and sea ice in these latitudes, because the ice sheets were too distant to have
colder climates provide a larger albedo-temperature feed- had large direct effects through changes in atmospheric
back to the initial CO changes. In contrast, at the high- circulation patterns, and because insolation values were
2
CO end of the range, snow and ice are reduced in extent, close to those today.
2
and little albedo feedback occurs. A second reason for the Estimates of the amount of glacial cooling in the trop-
varying sensitivity is that the trapping of Earth’s back radi- ics range from as small as –1.5°C (CLIMAP) to as large
ation becomes less efficient at higher CO concentrations as –4° or –5°C. This range of estimates indicates that
2
as the atmosphere gradually becomes saturated with CO . Earth’s sensitivity to CO largely falls within the range
2 2
The model used to generate Figure 18–15 had a indicated by climate models (see Figure 18–15). The
3°C increase in global temperature for a CO doubling smaller estimate of cooling from the CLIMAP recon-
2
from 280 to 560 ppm, just above the mid-range esti- struction would put Earth’s sensitivity at the lower end
mate of 2.5°C (see Figure 18–13). The range of uncer- of the range simulated by the models, while the larger
tainty from other GCM models (shown by the dashed (4°–5°C) cooling indicated by expanded mountain glaci-
lines in Figure 18–13) can be tested by examining inter- ers would push Earth’s sensitivity slightly beyond the high