
Page 360 - Earth's Climate Past and Future
P. 360
336 PART V • Historical and Future Climate Change
BOX 18-1 CLIMATE INTERACTIONS AND FEEDBACKS
Radiative Forcing of Recent Warming
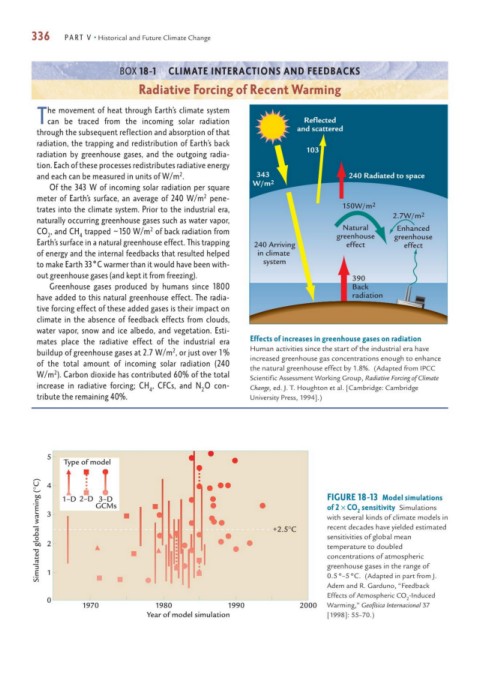
he movement of heat through Earth’s climate system
Tcan be traced from the incoming solar radiation Reflected
and scattered
through the subsequent reflection and absorption of that
radiation, the trapping and redistribution of Earth’s back
103
radiation by greenhouse gases, and the outgoing radia-
tion. Each of these processes redistributes radiative energy
2
and each can be measured in units of W/m . 343 240 Radiated to space
W/m 2
Of the 343 W of incoming solar radiation per square
2
meter of Earth’s surface, an average of 240 W/m pene-
150W/m 2
trates into the climate system. Prior to the industrial era,
2.7W/m 2
naturally occurring greenhouse gases such as water vapor,
2
CO , and CH trapped 150 W/m of back radiation from Natural Enhanced
2 4 ~ greenhouse greenhouse
Earth’s surface in a natural greenhouse effect. This trapping 240 Arriving effect effect
of energy and the internal feedbacks that resulted helped in climate
to make Earth 33°C warmer than it would have been with- system
out greenhouse gases (and kept it from freezing). 390
Greenhouse gases produced by humans since 1800 Back
have added to this natural greenhouse effect. The radia- radiation
tive forcing effect of these added gases is their impact on
climate in the absence of feedback effects from clouds,
water vapor, snow and ice albedo, and vegetation. Esti-
mates place the radiative effect of the industrial era Effects of increases in greenhouse gases on radiation
2
buildup of greenhouse gases at 2.7 W/m , or just over 1% Human activities since the start of the industrial era have
increased greenhouse gas concentrations enough to enhance
of the total amount of incoming solar radiation (240 the natural greenhouse effect by 1.8%. (Adapted from IPCC
2
W/m ). Carbon dioxide has contributed 60% of the total Scientific Assessment Working Group, Radiative Forcing of Climate
increase in radiative forcing; CH , CFCs, and N O con- Change, ed. J. T. Houghton et al. [Cambridge: Cambridge
4 2
tribute the remaining 40%. University Press, 1994].)
5
Type of model
Simulated global warming (°C) 3 1–D 2–D 3–D +2.5°C FIGURE 18-13 Model simulations
4
GCMs
of 2 × CO sensitivity Simulations
2
with several kinds of climate models in
recent decades have yielded estimated
sensitivities of global mean
2
temperature to doubled
concentrations of atmospheric
greenhouse gases in the range of
1
0.5°–5°C. (Adapted in part from J.
Adem and R. Garduno, “Feedback
Effects of Atmospheric CO -Induced
0 2
1970 1980 1990 2000 Warming,” Geofísica Internacional 37
Year of model simulation [1998]: 55–70.)