
Page 363 - Earth's Climate Past and Future
P. 363
CHAPTER 18 • Causes of Warming over the Last 125 Years 339
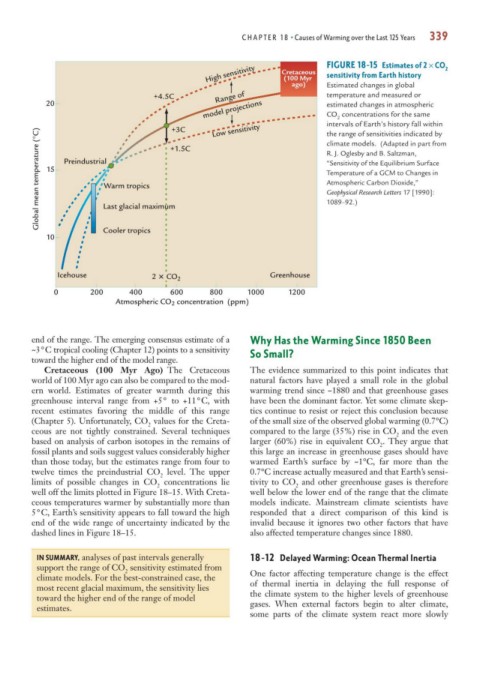
High sensitivity Cretaceous FIGURE 18-15 Estimates of 2 × CO 2
sensitivity from Earth history
(100 Myr
ago) Estimated changes in global
+4.5C Range of temperature and measured or
model projections CO concentrations for the same
20 estimated changes in atmospheric
2
intervals of Earth’s history fall within
Low sensitivity
+3C
Global mean temperature (°C) 15 Preindustrial Last glacial maximum R. J. Oglesby and B. Saltzman,
the range of sensitivities indicated by
climate models. (Adapted in part from
+1.5C
“Sensitivity of the Equilibrium Surface
Temperature of a GCM to Changes in
Atmospheric Carbon Dioxide,”
Warm tropics
Geophysical Research Letters 17 [1990]:
1089–92.)
10 Cooler tropics
Icehouse Greenhouse
2 CO 2
0 200 400 600 800 1000 1200
Atmospheric CO 2 concentration (ppm)
end of the range. The emerging consensus estimate of a Why Has the Warming Since 1850 Been
~3°C tropical cooling (Chapter 12) points to a sensitivity So Small?
toward the higher end of the model range.
Cretaceous (100 Myr Ago) The Cretaceous The evidence summarized to this point indicates that
world of 100 Myr ago can also be compared to the mod- natural factors have played a small role in the global
ern world. Estimates of greater warmth during this warming trend since ~1880 and that greenhouse gases
greenhouse interval range from +5° to +11°C, with have been the dominant factor. Yet some climate skep-
recent estimates favoring the middle of this range tics continue to resist or reject this conclusion because
(Chapter 5). Unfortunately, CO values for the Creta- of the small size of the observed global warming (0.7°C)
2
ceous are not tightly constrained. Several techniques compared to the large (35%) rise in CO and the even
2
based on analysis of carbon isotopes in the remains of larger (60%) rise in equivalent CO . They argue that
2
fossil plants and soils suggest values considerably higher this large an increase in greenhouse gases should have
than those today, but the estimates range from four to warmed Earth’s surface by ~1°C, far more than the
twelve times the preindustrial CO level. The upper 0.7°C increase actually measured and that Earth’s sensi-
2
limits of possible changes in CO concentrations lie tivity to CO and other greenhouse gases is therefore
2 2
well off the limits plotted in Figure 18–15. With Creta- well below the lower end of the range that the climate
ceous temperatures warmer by substantially more than models indicate. Mainstream climate scientists have
5°C, Earth’s sensitivity appears to fall toward the high responded that a direct comparison of this kind is
end of the wide range of uncertainty indicated by the invalid because it ignores two other factors that have
dashed lines in Figure 18–15. also affected temperature changes since 1880.
IN SUMMARY, analyses of past intervals generally 18-12 Delayed Warming: Ocean Thermal Inertia
support the range of CO sensitivity estimated from
2 One factor affecting temperature change is the effect
climate models. For the best-constrained case, the of thermal inertia in delaying the full response of
most recent glacial maximum, the sensitivity lies the climate system to the higher levels of greenhouse
toward the higher end of the range of model gases. When external factors begin to alter climate,
estimates.
some parts of the climate system react more slowly