
Page 210 - Electrical Equipment Handbook _ Troubleshooting and Maintenance
P. 210
VARIABLE-SPEED DRIVES
VARIABLE-SPEED DRIVES 10.9
These reflections result in an increase in the voltage transient levels on the terminals up
to twice the nominal level. This problem is normally dealt with by using special motor
insulation to withstand the higher voltages or by using a motor or an inverter filter.
TRANSIENTS, HARMONICS POWER FACTOR, AND
FAILURES
Semiconductor Failure Rate
Although thyristors, diodes, and IGBTs are solid-state devices, they have wearout mecha-
nisms just as insulation and other mechanical parts do. The wearout and failure rates of
these devices can be calculated.
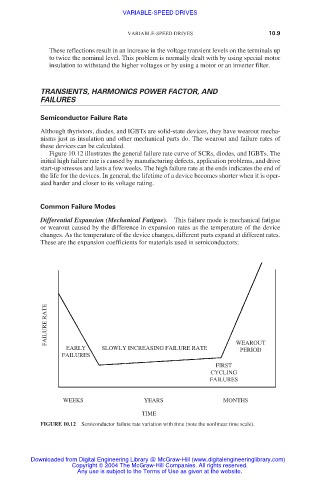
Figure 10.12 illustrates the general failure rate curve of SCRs, diodes, and IGBTs. The
initial high failure rate is caused by manufacturing defects, application problems, and drive
start-up stresses and lasts a few weeks. The high failure rate at the ends indicates the end of
the life for the devices. In general, the lifetime of a device becomes shorter when it is oper-
ated harder and closer to its voltage rating.
Common Failure Modes
Differential Expansion (Mechanical Fatigue). This failure mode is mechanical fatigue
or wearout caused by the difference in expansion rates as the temperature of the device
changes. As the temperature of the device changes, different parts expand at different rates.
These are the expansion coefficients for materials used in semiconductors:
FAILURE RATE
EARLY SLOWLY INCREASING FAILURE RATE WEAROUT
PERIOD
FAILURES
FIRST
CYCLING
FAILURES
WEEKS YEARS MONTHS
TIME
FIGURE 10.12 Semiconductor failure rate variation with time (note the nonlinear time scale).
Downloaded from Digital Engineering Library @ McGraw-Hill (www.digitalengineeringlibrary.com)
Copyright © 2004 The McGraw-Hill Companies. All rights reserved.
Any use is subject to the Terms of Use as given at the website.