
Page 204 - Electrical Safety of Low Voltage Systems
P. 204
Earth Electrodes, Protective Conductors 187
adiabatic process, that is, neglect the thermal exchange by convection
or radiation between the PE and the surrounding environment. In this
case, all the heat developed by the fault accumulates in the protective
conductor, as well as in all the components present in the fault loop,
with the result to raise their temperatures. This assumption is amply
justified since the fault is generally cleared within tens of milliseconds,
while the heat transfer requires more time to take place.
In analogy with the procedure described in Chap. 5, the adia-
2
batic process for a conductor of length l, cross-sectional area S (mm ),
resistivity ( · mm), and volumetric specific heat capacity c [(J/
3
( C · mm )] can be described by the thermal balance of Eq. (11.1):
◦
l
2
i dt = Slcd (11.1)
S
If a fault current i(t) flows through the protective conductor for the
infinitesimal time dt, the conductor undergoes a temperature rise d .
d represents the difference between the initial temperature 0 of the
conductor, at the inception of the fault, and its final temperature f ,
afterthefaultiscleared.Thus,theleft-handsideofEq.(11.1)represents
the heat developed by the fault current during dt, whereas the right-
hand side is the heat accumulated in the conductor during the same
time.
We may also reasonably assume that the protective conductor’s
cross-sectional area S does not vary significantly during the temper-
ature variation caused by the fault current. The resistivity of the con-
ductor, instead, cannot be considered constant with the temperature
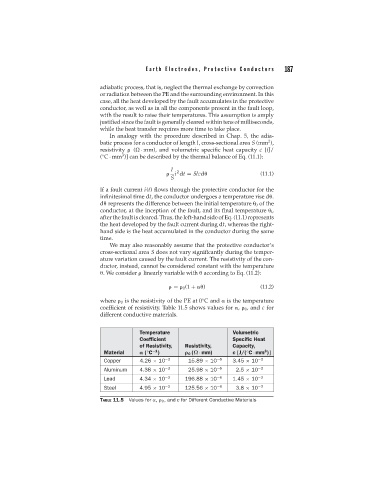
. We consider linearly variable with according to Eq. (11.2):
= 0 (1 + ) (11.2)
where 0 is the resistivity of the PE at 0 C and is the temperature
◦
coefficient of resistivity. Table 11.5 shows values for , 0 , and c for
different conductive materials.
Temperature Volumetric
Coefficient Specific Heat
of Resistivity, Resistivity, Capacity,
3
−1
Material ( C ) 0 (Ω · mm) c [J/( C · mm )]
◦
◦
Copper 4.26 × 10 −3 15.89 × 10 −6 3.45 × 10 −3
Aluminum 4.38 × 10 −3 25.98 × 10 −6 2.5 × 10 −3
Lead 4.34 × 10 −3 196.88 × 10 −6 1.45 × 10 −3
Steel 4.95 × 10 −3 125.56 × 10 −6 3.8 × 10 −3
TABLE 11.5 Values for , 0 , and c for Different Conductive Materials