
Page 276 - Elements of Chemical Reaction Engineering 3rd Edition
P. 276
248 Collection and Analysis of Rate Data Chap. 5
4 6 8 .IO
&(at m 1
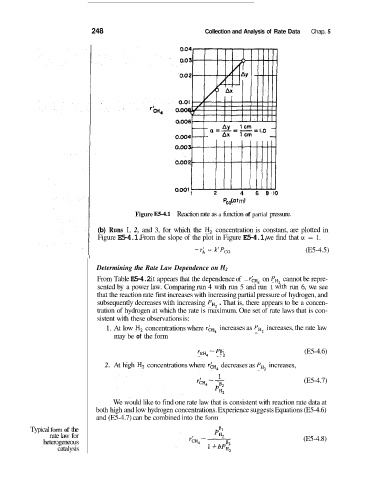
Figure E5-4.1 Reaction rate as a function of partial pressure.
(b) Runs I, 2, and 3, for which the H, concentration is constant, are plotted in
Figure E5-4.1. From the slope of the plot in Figure E5-4.1, we find that (Y = 1.
-ri = k'Pco (E5-4.5)
I
Determining the Rate Law Dependence on H2
From Table E5-4.2 it appears that the dependence of - r& on P, cannot be repre-
sented by a power law. Comparing run 4 with run 5 and run 1 dith run 6, we see
that the reaction rate first increases with increasing partial pressure of hydrogen, and
subsequently decreases with increasing PH2 . That is, there appears to be a concen-
tration of hydrogen at which the rate is maximum. One set of rate laws that is con-
sistent with these observations is:
1. At low H, concentrations where increases as PH2 increases, the rate law
may be of the form
Tell4 - PH2 (E5-4.6)
PI
I
2. At high H, concentrations where rkH4 decreases as PH2 increases,
(E5-4.7)
We would like to find one rate law that is consistent with reaction rate data at
both high and low hydrogen concentrations. Experience suggests Equations (E5-4.6)
and (E5-4.7) can be combined into the form
Typical form of the
rate law for
heterogeneous (E5-4.8)
catalysis