
Page 280 - Elements of Chemical Reaction Engineering 3rd Edition
P. 280
252 Collection and Analysis of Rate Data Chap. 5
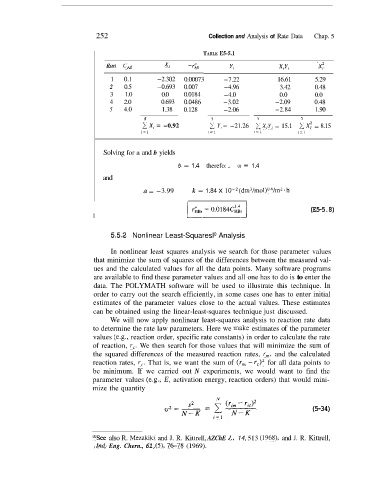
TABLE E5-5.1
Ruri C,, x, - i-&
1 0.1 -2.302 0.00073 -7.22 16.61 5.29
2 0.5 -0.693 0.007 -4.96 3.42 0.48
3 1.0 0.0 0.0184 -4.0 0.0 0.0
4 2.0 0.693 0.0486 -3.02 -2.09 0.48
5 4.0 1.38 0.128 -2.06 -2.84 1.90
5 5 5 5
2 X, = -0.92 2 Y, = -21.26 1 X,Y, = 15.1 Xf = 8.15
i=l ,=I 1=1 I= I
Solving for a and b yields
b = 1.4 therefo: a = 1.4
and
k = 1.84 x 10⁻²(dm3/m01)~~/rn~~h
a = -3.99 -
I
I (E5-5.8)
o
5.5.2 Nonlinear Least-Squaresl Analysis
In nonlinear least squares analysis we search for those parameter values
that minimize the sum of squares of the differences between the measured val-
ues and the calculated values for all the data points. Many software programs
are available to find these parameter values and all one has to do is to enter the
data. The POLYMATH software will be used to illustrate this technique. In
order to carry out the search efficiently, in some cases one has to enter initial
estimates of the parameter values close to the actual values. These estimates
can be obtained using the linear-least-squares technique just discussed.
We will now apply nonlinear least-squares analysis to reaction rate data
to determine the rate law parameters. Here we make estimates of the parameter
values (e.g., reaction order, specific rate constants) in order to calculate the rate
of reaction, r,. We then search for those values that will minimize the sum of
the squared differences of the measured reaction rates, Y,, and the calculated
reaction rates, Y,. That is, we want the sum of (Y, - rJ2 for all data points to
be minimum. If we carried out N experiments, we would want to find the
parameter values (e.g., E, activation energy, reaction orders) that would mini-
mize the quantity
(5-34)
losee also R. Mezakiki and J. R. Kittrell, AZChE I., 14, 513 (1968), and J. R. Kittrell,
~Znd. Eng. Chern., 61, (5), 76-78 (1969).