
Page 286 - Elements of Chemical Reaction Engineering 3rd Edition
P. 286
258 Collection and Analysis of Rate Data Chap. 5
Convwged a95 cmf. . louw uppw
Ke 2.21108 0.316885 1.89219 2.52996
Ka 0.0426414 0.07135% -0.0285181 0,114201
tlodel: ra=kiPerPN/iI+KexPe+KanBea)
I: = 3,34788 Ka 0.0428414
KP 2.2LIos
6 posihve residuals, 3 neqacive residuals. Sum oi spw~ 0.0296167
(E5-6.2)
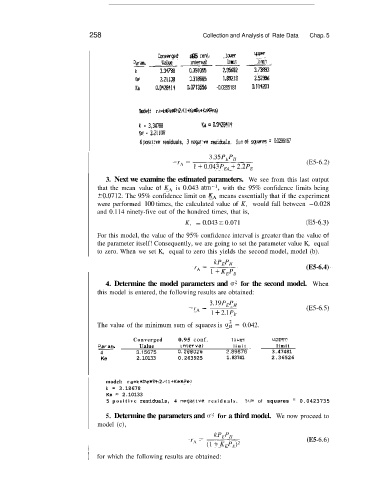
3. Next we examine the estimated parameters. We see from this last output
that the mean value of KA is 0.043 atm-I, with the 95% confidence limits being
50.0712. The 95% confidence limit on K, means essentially that if the experiment
were performed 100 times, the calculated value of K, would fall between -0.028
and 0.114 ninety-five out of the hundred times, that is,
K, = 0.043 ? 0.071 (E5-6.3)
For this model, the value of the 95% confidence interval is greater than the value of
the parameter itself! Consequently, we are going to set the parameter value K, equal
to zero. When we set K, equal to zero this yields the second model, model (b).
(E5-6.4) -
4. Determine the model parameters and u2 for the second model. When
this model is entered, the following results are obtained:
3.19PEP,
-rA = (E5-6.5)
1 + 2.1 P,
2
The value of the minimum sum of squares is uB = 0.042.
Converged 0.95 conf. 1 mer upper
Param. Ualue Interval limit limit
4 3.15675 0.2eeoz6 2.89876 3.47481
Ke 2.10133 0.263925 1.83741 2.36526
model: r a=kxPeYIPhZAl+KeiPe>
k = 3.18678
Ke = 2.10133
5 positive residuals, 4 negative residuals. <;im of squares 0.0423735
5. Determine the parameters and u2 for a third model. We now proceed to
model (c),
(E5 -6.6)
1 for which the following results are obtained: