
Page 290 - Elements of Chemical Reaction Engineering 3rd Edition
P. 290
262 Collection and Analysis of Rate Data Chap. 5
5.6 Experimental Planning
Four to six weeks in the lab can save you an hour in
the library.
G. C. Quarderer, Dow Chemical Co.
So far, this chapter has presented various methods of analyzing rate data. It is
just as important to know in which -circumstances to use each method as it is
to know the mechanics of these methods. In this section we-discuss a heuristic
to plan experiments to generate the data necessary for reactor design. However,
only a thumbnail sketch is presented; for a more thorough discussion the
reader is referred to the books and articles by Box and Hunter.15
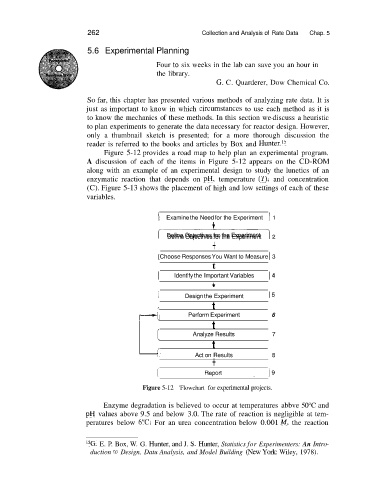
Figure 5-12 provides a road map to help plan an experimental program.
A discussion of each of the items in Figure 5-12 appears on the CD-ROM
along with an example of an experimental design to study the lunetics of an
enzymatic reaction that depends on pH, temperature (T), and concentration
(C). Figure 5-13 shows the placement of high and low settings of each of these
variables.
/ Examine the Need for the Experiment 1 1
+---I Define Objectives for the Experiment 2
+
[Choose Responses You Want to Measure 1 3
t
I Identify the Important Variables 1 4
I Design the Experiment 15
t
r
Perform Experiment 6
t
I Analyze Results 7
t
r Act on Results
+ 8
Figure 5-12 'Flowchart for experimental projects.
Enzyme degradation is believed to occur at temperatures abbve 50°C and
pH values above 9.5 and below 3.0. The rate of reaction is negligible at tem-
peratures below 6°C. For an urea concentration below 0.001 M, the reaction
15G. E. P. Box, W. G. Hunter, and J. S. Hunter, Statistics for Experimenters: An Intro-
duction to Design, Datu Analysis, and Model Building (New York: Wiley, 1978).