
Page 198 - Embedded Microprocessor Systems Real World Design
P. 198
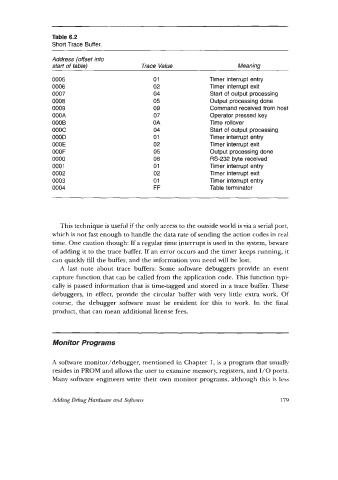
Table 6.2
                 Short Trace Buffer.

                 Address (offset into
                 start of table)            Trace Value                  Meaning
                 0005                           01               Timer interrupt entry
                 0006                           02               Timer interrupt exit
                 0007                           04               Start of  output processing
                 0008                           05               Output processing done
                 0009                           09               Command received from host
                 OOOA                           07               Operator pressed key
                 OOOB                          OA                Time rollover
                 oooc                           04               Start of output processing
                 OOOD                           01               Xmer interrupt entry
                 OOOE                           02               Timer interrupt exit
                 OOOF                           05               Output processing done
                 0000                           08               RS-232 byte received
                 0001                           01               Timer interrupt entry
                 0002                           02               Timer interrupt exit
                 0003                           01               Timer interrupt entry
                 0004                           FF               Table terminator


                   This technique is useful if the only access to the outside world is via a serial port,
                 which is not fast enough to handle the data rate of sending the action codes in real
                 time. One caution though: If a regular time interrupt is used in the system, beware
                 of adding it to the trace buffer. If an error occurs and the timer keeps running, it
                 can quickly fill the buffer, and the information you need will be lost.
                   A  last  note  about  trace  buffers:  Some  software debuggers provide  an  event
                 capture function that can be called from the application code. This function typi-
                 cally is passed information that is time-tagged and stored in a trace buffer. These
                 debuggers,  in  effect, provide  the  circular  buffer  with  very  little  extra work.  Of
                 course,  the  debugger  software must  be  resident  for  this  to  work.  In  the  final
                 product, that can mean additional license fees.


                 Monitor Programs


                 A software monitor/debugger,  mentioned in Chapter 1, is a program that usually
                 resides in PROM and allows the user to examine memory, registers, and 1/0 ports.
                 Many  software engineers write their own  monitor programs, although this is less


                 Adding Debug Hardware and Software                                   179