
Page 205 - Academic Press Encyclopedia of Physical Science and Technology 3rd BioTechnology
P. 205
P1: GTV/MBR P2: GSS Final Pages
Encyclopedia of Physical Science and Technology EN011L-523 August 10, 2001 11:17
Optical Fiber Techniques for Medical Applications 325
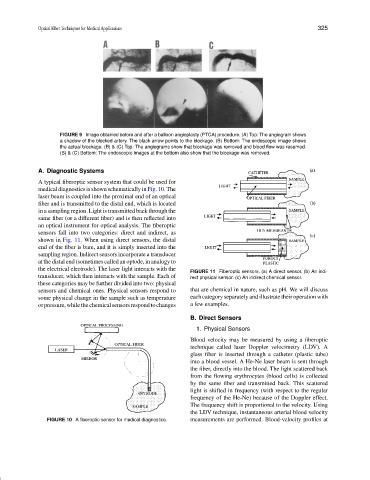
FIGURE 9 Image obtained before and after a balloon angioplasty (PTCA) procedure. (A) Top: The angiogram shows
a shadow of the blocked artery. The black arrow points to the blockage. (B) Bottom: The endoscopic image shows
the actual blockage. (B) & (C) Top: The angiograms show that blockage was removed and blood flow was resumed.
(B) & (C) Bottom: The endoscopic images at the bottom also show that the blockage was removed.
A. Diagnostic Systems
A typical fiberoptic sensor system that could be used for
medical diagnostics is shown schematically in Fig. 10. The
laser beam is coupled into the proximal end of an optical
fiber and is transmitted to the distal end, which is located
in a sampling region. Light is transmitted back through the
same fiber (or a different fiber) and is then reflected into
an optical instrument for optical analysis. The fiberoptic
sensors fall into two categories: direct and indirect, as
shown in Fig. 11. When using direct sensors, the distal
end of the fiber is bare, and it is simply inserted into the
sampling region. Indirect sensors incorporate a transducer
at the distal end (sometimes called an optode, in analogy to
the electrical electrode). The laser light interacts with the
FIGURE 11 Fiberoptic sensors. (a) A direct sensor. (b) An indi-
transducer, which then interacts with the sample. Each of rect physical sensor. (c) An indirect chemical sensor.
these categories may be further divided into two: physical
sensors and chemical ones. Physical sensors respond to that are chemical in nature, such as pH. We will discuss
some physical change in the sample such as temperature each category separately and illustrate their operation with
or pressure, while the chemical sensors respond to changes a few examples.
B. Direct Sensors
1. Physical Sensors
Blood velocity may be measured by using a fiberoptic
technique called laser Doppler velocimetry (LDV). A
glass fiber is inserted through a catheter (plastic tube)
into a blood vessel. A He-Ne laser beam is sent through
the fiber, directly into the blood. The light scattered back
from the flowing erythrocytes (blood cells) is collected
by the same fiber and transmitted back. This scattered
light is shifted in frequency (with respect to the regular
frequency of the He-Ne) because of the Doppler effect.
The frequency shift is proportional to the velocity. Using
the LDV technique, instantaneous arterial blood velocity
FIGURE 10 A fiberoptic sensor for medical diagnostics. measurements are performed. Blood-velocity profiles at