
Page 96 - Academic Press Encyclopedia of Physical Science and Technology 3rd BioTechnology
P. 96
P1: GNB Final Pages
Encyclopedia of Physical Science and Technology EN005F-954 June 15, 2001 20:48
Fiber-Optic Chemical Sensors 809
can be measured using several different optical phenom-
ena. These phenomena transduce the interactions of light
with the sensing materials into an (ideally) quantitative
signal that can be correlated to the analyte identities and
concentrations.
1. Absorption
Absorption is based on the light intensity changes due to
modulation by a substance in the sample. Light absorp-
tion is a process in which electromagnetic energy is trans-
ferred to an atom or a molecule. This energy promotes the
transition of the molecule from the ground energy state
to a higher energy excited state. The resulting energy is
dissipated nonradiatively (i.e., thermally) to the medium
when the excited state relaxes to the ground state. Each FIGURE 6 Typical fluorescence spectrum showing the strokes
molecule (analyte) can be excited at a single wavelength or shift at longer wavelengths from the excitation spectrum.
several wavelengths, which furnishes a unique absorption
spectrum characteristic of the molecule. The absorbance
3. Time-Resolved Fluorescence Spectroscopy
changes are related to the analyte concentration [C] via
the Beer–Lambert relationship: This method is based on the excited-state lifetime. The
light intensity emitted from molecules excited by a short
A = log(I 0 /I) = ε · [C] · l, (4)
pulse of light decays exponentially with time. This decay
where A is the optical absorbance, I 0 and I are the inten- pattern is unique for each molecule and can be used for
sities of transmitted light in the absence and presence of analytical purposes. Alternatively, a phase shift method
the absorbing species, respectively, l is the effective path can be employed to measure the fluorescence lifetime. A
length, and ε is the molar absorption coefficient. In prac- sinusoidally varying excitation light source is used and the
tice, optical fibers are connected to a spectrophotometer phase shift between the excitation waveform and the emis-
and the measured changes correlate the analyte concen- sion waveform can be used to detect the analytical signal.
tration to the absorption at a given wavelength.
4. Fluorescence Energy Transfer
2. Fluorescence
This phenomenon occurs when two distinct fluorophores
When fluorescent molecules are excited at a specificwave- are present. If the emission spectrum of one fluorophore
length, the molecule reemits radiation at a lower energy, overlaps with the excitation spectrum of a second fluo-
i.e., a longer wavelength. The absorption of the excitation rophore and the two fluorophores are in sufficient prox-
˚
light shifts the molecule’s energy from the ground state to imity (<100 A), then the excited fluorophore (donor) can
a higher energy state. The molecule emits fluorescent light transfer energy nonradiatively to the second fluorophore
when it returns to the ground state. The distinct ranges of (acceptor). This transfer results in an increase in light
wavelengths over which the molecule is excited and emits emission by the acceptor and a decrease in light emis-
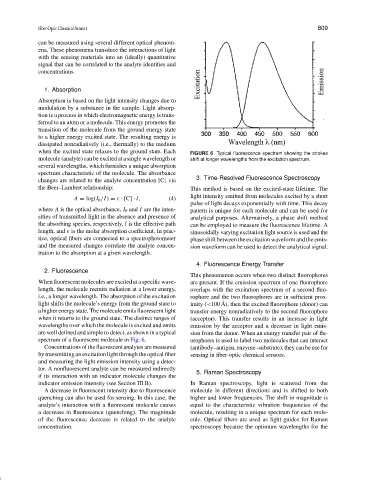
are well defined and simple to detect, as shown in a typical sion from the donor. When an energy transfer pair of flu-
spectrum of a fluorescent molecule in Fig. 6. orophores is used to label two molecules that can interact
Concentrations of the fluorescent analytes are measured (antibody–antigen, enzyme–substrate), they can be use for
by transmitting an excitation light through the optical fiber sensing in fiber-optic chemical sensors.
and measuring the light emission intensity using a detec-
tor. A nonfluorescent analyte can be measured indirectly
5. Raman Spectroscopy
if its interaction with an indicator molecule changes the
indicator emission intensity (see Section III.B). In Raman spectroscopy, light is scattered from the
A decrease in fluorescent intensity due to fluorescence molecule in different directions and is shifted to both
quenching can also be used for sensing. In this case, the higher and lower frequencies. The shift in magnitude is
analyte’s interaction with a fluorescent molecule causes equal to the characteristic vibration frequencies of the
a decrease in fluorescence (quenching). The magnitude molecule, resulting in a unique spectrum for each mole-
of the fluorescence decrease is related to the analyte cule. Optical fibers are used as light guides for Raman
concentration. spectroscopy because the optimum wavelengths for the