
Page 15 - Academic Press Encyclopedia of Physical Science and Technology 3rd Chemical Engineering
P. 15
P1: LDK Revised Pages
Encyclopedia of Physical Science and Technology EN001H-01 May 7, 2001 16:18
12 Absorption (Chemical Engineering)
Equation (24) is an equation of a straight line when plot- (x , y ), one draws a horizontal line back to the operating
N N
ted on x − y coordinates, with a slope of L /G and an line, thus solving the material balance to obtain x . The
M M N−1
intercept of y − L x /G . This line is often referred to process is then continued until the top liquid composition
1 M 0 M
as the operating line and is the locus of all the points that x is reached (Fig. 10). Each step shown on the diagram
0
obey the stage material balance given by Eq. (20). represents one ideal stage; the number of ideal stages is
For dilute solutions, L ≈ L M , G ≈ G M , x ≈ x, and counted from the diagram.
M M
y ≈ y, Eq. (24) simplifies to Often, slightly different coordinates are used for y–x
plotting. Instead of plotting y against x , one can plot y
L M L M
y n = x n−1 + y 1 − x 0 (25) against x; in this case, the operating line will be curved. At
G M G M
other times, y can be expressed in terms of moles of solute
per mole of gas leaving the absorber. The construction
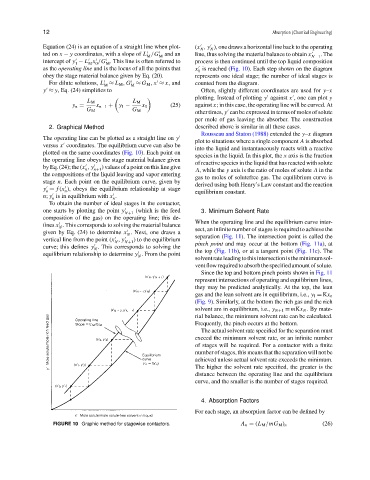
2. Graphical Method described above is similar in all these cases.
Rousseau and Staton (1988) extended the y–x diagram
The operating line can be plotted as a straight line on y
plot to situations where a single component A is absorbed
versus x coordinates. The equilibrium curve can also be
into the liquid and instantaneously reacts with a reactive
plotted on the same coordinates (Fig. 10). Each point on
species in the liquid. In this plot, the x axis is the fraction
the operating line obeys the stage material balance given
of reactive species in the liquid that has reacted with solute
by Eq. (24); the (x , y ) values of a point on this line give
n n+1 A, while the y axis is the ratio of moles of solute A in the
the compositions of the liquid leaving and vapor entering
gas to moles of solutefree gas. The equilibrium curve is
stage n. Each point on the equilibrium curve, given by
derived using both Henry’s Law constant and the reaction
y = f (x ), obeys the equilibrium relationship at stage
n n equilibrium constant.
n; y is in equilibrium with x .
n
n
To obtain the number of ideal stages in the contactor,
one starts by plotting the point y (which is the feed 3. Minimum Solvent Rate
N+1
composition of the gas) on the operating line; this de-
When the operating line and the equilibrium curve inter-
fines x . This corresponds to solving the material balance
N
given by Eq. (24) to determine x . Next, one draws a sect, an infinite number of stages is required to achieve the
N
vertical line from the point (x , y N+1 ) to the equilibrium separation (Fig. 11). The intersection point is called the
N
curve; this defines y . This corresponds to solving the pinch point and may occur at the bottom (Fig. 11a), at
N the top (Fig. 11b), or at a tangent point (Fig. 11c). The
equilibrium relationship to determine y . From the point
N
solventrateleadingtothisintersectionistheminimumsol-
ventflowrequiredtoabsorbthespecifiedamountofsolute.
Since the top and bottom pinch points shown in Fig. 11
represent intersections of operating and equilibrium lines,
they may be predicted analytically. At the top, the lean
gas and the lean solvent are in equilibrium, i.e., y 1 = Kx o
(Fig. 9). Similarly, at the bottom the rich gas and the rich
solvent are in equilibrium, i.e., y N+1 = mKx N . By mate-
rial balance, the minimum solvent rate can be calculated.
Frequently, the pinch occurs at the bottom.
The actual solvent rate specified for the separation must
exceed the minimum solvent rate, or an infinite number
of stages will be required. For a contactor with a finite
number of stages, this means that the separation will not be
achieved unless actual solvent rate exceeds the minimum.
The higher the solvent rate specified, the greater is the
distance between the operating line and the equilibrium
curve, and the smaller is the number of stages required.
4. Absorption Factors
For each stage, an absorption factor can be defined by
FIGURE 10 Graphic method for stagewise contactors. A n = (L M /mG M ) n (26)