
Page 17 - Academic Press Encyclopedia of Physical Science and Technology 3rd Chemical Engineering
P. 17
P1: LDK Revised Pages
Encyclopedia of Physical Science and Technology EN001H-01 May 7, 2001 16:18
14 Absorption (Chemical Engineering)
Using these definitions, Eq. (28) becomes
y − y A N+1 L x
N+1 1 e − A e M 0
= 1 − (30c)
y A N+1 − 1 A G y
N+1 e M N+1
Hines and Maddox (1985) found that the Edmister method
gives a close approximation to observed or rigorously
computed concentration gradients in many multicompo-
nent absorbers.
5. Other Procedures
Graphical procedures such as those described above can
also be extended to multicomponent absorption. This sub-
ject is discussed in detail by Sherwood (1975).
Amethodsuitableforcomputercalculations,whichcar-
ries out tray-by-tray mass, component, and heat balances
was first developed by Sujata (1961). In this method, the
liquid and vapor flow rates and the temperature profile
are assumed and used to calculate an absorption factor for
each stage [Eq. (26)]. A component balance is written for
each stage in terms of the component flows and absorp-
tion factors. The component balances are solved by matrix FIGURE 12 Schematic diagram of a nonequilibrium stage n.
techniques to give component flows for each stage. Energy
balances are then solved to obtain a new temperature pro-
file. The total vapor and liquid flow profiles are found by
mate absorber performance than can an equilibrium stage
summing the individual component flows. The calculation
model. The success of rate models in absorption is largely
is then repeated with the updated temperatures and flows
a result of the difficulty of reliably predicting stage effi-
in a trial-and-error manner, until convergence is reached.
ciencies in absorbers. The presence of many components,
There are several variations of the above procedure. Some
low stage efficiencies, significant heat effects, and chemi-
of the popular ones are discussed in Wankat’s text. Some
rigorous distillation methods have also been extended to cal reactions are commonly encountered in absorbers and
absorption. difficult to accommodate in stage efficiency prediction.
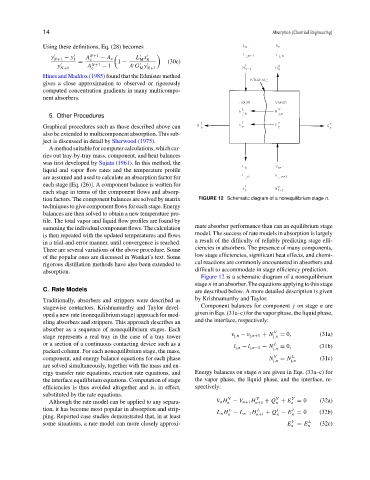
Figure 12 is a schematic diagram of a nonequilibrium
stage n in an absorber. The equations applying to this stage
C. Rate Models are described below. A more detailed description is given
Traditionally, absorbers and strippers were described as by Krishnamurthy and Taylor.
stagewise contactors. Krishnamurthy and Taylor devel- Component balances for component j on stage n are
oped a new rate (nonequilibrium stage) approach for mod- given in Eqs. (31a–c) for the vapor phase, the liquid phase,
eling absorbers and strippers. This approach describes an and the interface, respectively:
absorber as a sequence of nonequilibrium stages. Each V
v j,n − v j,n+1 + N = 0, (31a)
stage represents a real tray in the case of a tray tower j,n
or a section of a continuous contacting device such as a L
l j,n − l j,n−1 − N j,n = 0, (31b)
packed column. For each nonequilibrium stage, the mass,
V L
component, and energy balance equations for each phase N j,n = N j,n (31c)
are solved simultaneously, together with the mass and en-
ergy transfer rate equations, reaction rate equations, and Energy balances on stage n are given in Eqs. (33a–c) for
the interface equilibrium equations. Computation of stage the vapor phase, the liquid phase, and the interface, re-
efficiencies is thus avoided altogether and is, in effect, spectively:
substituted by the rate equations. V V V V
Although the rate model can be applied to any separa- V n H − V n+1 H n+1 + Q + E = 0 (32a)
n
n
n
tion, it has become most popular in absorption and strip- L L L L
L n H − L n−1 H n+1 + Q − E = 0 (32b)
n
n
n
ping. Reported case studies demonstrated that, in at least
V
some situations, a rate model can more closely approxi- E = E L (32c)
n n