
Page 282 - Academic Press Encyclopedia of Physical Science and Technology 3rd Chemical Engineering
P. 282
P1: FYK/LPB P2: FPP Final
Encyclopedia of Physical Science and Technology EN006C-252 June 27, 2001 14:15
82 Fluid Mixing
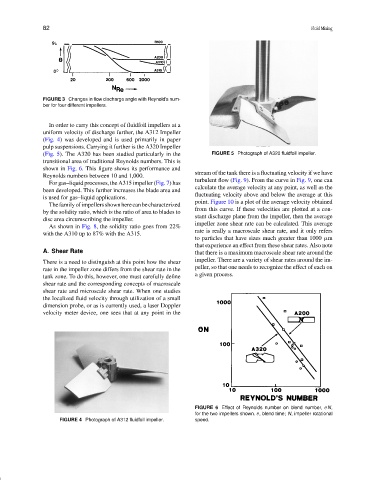
FIGURE 3 Changes in flow discharge angle with Reynold’s num-
ber for four different impellers.
In order to carry this concept of fluidfoil impellers at a
uniform velocity of discharge further, the A312 Impeller
(Fig. 4) was developed and is used primarily in paper
pulp suspensions. Carrying it further is the A320 Impeller
(Fig. 5). The A320 has been studied particularly in the FIGURE 5 Photograph of A320 fluidfoil impeller.
transitional area of traditional Reynolds numbers. This is
shown in Fig. 6. This figure shows its performance and
stream of the tank there is a fluctuating velocity if we have
Reynolds numbers between 10 and 1,000.
turbulent flow (Fig. 9). From the curve in Fig. 9, one can
For gas–liquid processes, the A315 impeller (Fig. 7) has
calculate the average velocity at any point, as well as the
been developed. This further increases the blade area and
fluctuating velocity above and below the average at this
is used for gas–liquid applications.
point. Figure 10 is a plot of the average velocity obtained
Thefamilyofimpellersshownherecanbecharacterized
from this curve. If these velocities are plotted at a con-
by the solidity ratio, which is the ratio of area to blades to
stant discharge plane from the impeller, then the average
disc area circumscribing the impeller.
impeller zone shear rate can be calculated. This average
As shown in Fig. 8, the solidity ratio goes from 22%
rate is really a macroscale shear rate, and it only refers
with the A310 up to 87% with the A315.
to particles that have sizes much greater than 1000 µm
that experience an effect from these shear rates. Also note
A. Shear Rate that there is a maximum macroscale shear rate around the
There is a need to distinguish at this point how the shear impeller. There are a variety of shear rates around the im-
rate in the impeller zone differs from the shear rate in the peller, so that one needs to recognize the effect of each on
tank zone. To do this, however, one must carefully define a given process.
shear rate and the corresponding concepts of macroscale
shear rate and microscale shear rate. When one studies
the localized fluid velocity through utilization of a small
dimension probe, or as is currently used, a laser Doppler
velocity meter device, one sees that at any point in the
FIGURE 6 Effect of Reynolds number on blend number, θ N,
for the two impellers shown. θ, blend time; N, impeller rotational
FIGURE 4 Photograph of A312 fluidfoil impeller. speed.