
Page 286 - Academic Press Encyclopedia of Physical Science and Technology 3rd Chemical Engineering
P. 286
P1: FYK/LPB P2: FPP Final
Encyclopedia of Physical Science and Technology EN006C-252 June 27, 2001 14:15
86 Fluid Mixing
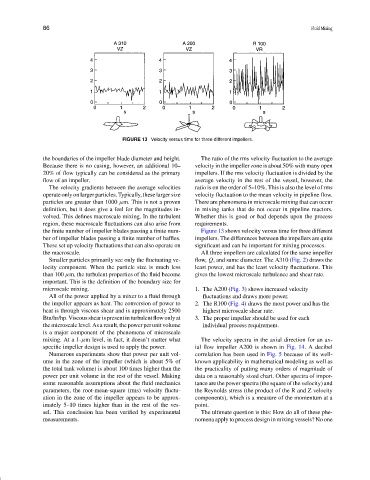
FIGURE 13 Velocity versus time for three different impellers.
the boundaries of the impeller blade diameter and height. The ratio of the rms velocity fluctuation to the average
Because there is no casing, however, an additional 10– velocity in the impeller zone is about 50% with many open
20% of flow typically can be considered as the primary impellers. If the rms velocity fluctuation is divided by the
flow of an impeller. average velocity in the rest of the vessel, however, the
The velocity gradients between the average velocities ratio is on the order of 5–10%. This is also the level of rms
operate only on larger particles. Typically, these larger size velocity fluctuation to the mean velocity in pipeline flow.
particles are greater than 1000 µm. This is not a proven There are phenomena in microscale mixing that can occur
definition, but it does give a feel for the magnitudes in- in mixing tanks that do not occur in pipeline reactors.
volved. This defines macroscale mixing. In the turbulent Whether this is good or bad depends upon the process
region, these macroscale fluctuations can also arise from requirements.
the finite number of impeller blades passing a finite num- Figure 13 shows velocity versus time for three different
ber of impeller blades passing a finite number of baffles. impellers. The differences between the impellers are quite
These set up velocity fluctuations that can also operate on significant and can be important for mixing processes.
the macroscale. All three impellers are calculated for the same impeller
Smaller particles primarily see only the fluctuating ve- flow, Q, and same diameter. The A310 (Fig. 2) draws the
locity component. When the particle size is much less least power, and has the least velocity fluctuations. This
than 100 µm, the turbulent properties of the fluid become gives the lowest microscale turbulence and shear rate.
important. This is the definition of the boundary size for
microscale mixing. 1. The A200 (Fig. 3) shows increased velocity
All of the power applied by a mixer to a fluid through fluctuations and draws more power.
the impeller appears as heat. The conversion of power to 2. The R100 (Fig. 4) draws the most power and has the
heat is through viscous shear and is approximately 2500 highest microscale shear rate.
Btu/hr/hp.Viscousshearispresentinturbulentflowonlyat 3. The proper impeller should be used for each
the microscale level. As a result, the power per unit volume individual process requirement.
is a major component of the phenomena of microscale
mixing. At a 1-µm level, in fact, it doesn’t matter what The velocity spectra in the axial direction for an ax-
specific impeller design is used to apply the power. ial flow impeller A200 is shown in Fig. 14. A decibel
Numerous experiments show that power per unit vol- correlation has been used in Fig. 5 because of its well-
ume in the zone of the impeller (which is about 5% of known applicability in mathematical modeling as well as
the total tank volume) is about 100 times higher than the the practicality of putting many orders of magnitude of
power per unit volume in the rest of the vessel. Making data on a reasonably sized chart. Other spectra of impor-
some reasonable assumptions about the fluid mechanics tance are the power spectra (the square of the velocity) and
parameters, the root-mean-square (rms) velocity fluctu- the Reynolds stress (the product of the R and Z velocity
ation in the zone of the impeller appears to be approx- components), which is a measure of the momentum at a
imately 5–10 times higher than in the rest of the ves- point.
sel. This conclusion has been verified by experimental The ultimate question is this: How do all of these phe-
measurements. nomena apply to process design in mixing vessels? No one