
Page 288 - Academic Press Encyclopedia of Physical Science and Technology 3rd Chemical Engineering
P. 288
P1: FYK/LPB P2: FPP Final
Encyclopedia of Physical Science and Technology EN006C-252 June 27, 2001 14:15
88 Fluid Mixing
pumping capacity, pumping capacity per unit volume, im- Both Table III and Fig. 15 are based on geometric similar-
peller tip speed, and Reynolds number. In the second col- ity. One way to modify these marked changes in mixing
umn, all these values are given a common value of 1.0, parameters and scaleup is to use nongeometric similar-
to examine the changes relative to each other on scaleup. ity on scaleup. The problem is that the big tank has a
In the remaining columns, a specific variable is held con- much longer blend time than the small tank. The large
stant. When power per unit volume is constant, the speed tank has a greater variety of shear rates and has a higher
drops, the flow increases, but the flow per unit volume de- Reynolds number than a small tank. These effects can be
creases. The impeller tip speed goes up, and the Reynolds greatly modified by using nongeometric impellers in the
number goes up. It is quite apparent that the ratio of all pilot plant.
the variables cannot be maintained as in the pilot plant. In
addition, it appears that the maximum impeller zone shear
A. Role of Dynamic and Geometric Similarity
rate will increase, while the circulating time and the im-
peller Reynolds number increase. This means that the big Equations (4) and (5) show the relationship for geometric
tank will be much different from the small tank in several and dynamic similarity, respectively, and illustrates four
potentially key parameters. When the flow per unit vol- basic fluid force ratios.
ume is held constant, the power per unit volume increases
X M
in proportion to the square of the tank diameter ratio. This = X R (3)
is possible to do but is normally impractical. X P
When the impeller tip speed is held constant, the same (F I ) M (F µ ) M (F g ) M (F σ ) M
= = = = F R (4)
maximum shear rate is maintained. However, the average (F I ) P (F µ ) P (F g ) P (F σ ) P
impeller shear rate related to impeller speed drops dramat-
where F isthefluidforce, I theinertiaforce, µ,theviscous
ically, and the power per unit volume drops inversely to
force, g the gravitational force, σ the surface tension force,
the tank size ratio. In general, this is a very unconserva-
M the model, P the prototype, and R the ratio. Subscript I is
tive scaleup technique and can lead to insufficient process
the inertia force added by the mixer, and it is desirable that
results on full scale.
it remain constant between the model M and the prototype
The final column shows results for a constant Reynolds
P. Three fluid forces oppose the successful completion
number, which requires that the total power decrease on
this process: viscosity, gravity, and fluid interfacial surface
scaleup. This is not normally practical, and therefore we
tension. It is impossible to keep these force ratios constant
must accept an increased Reynolds number on scaleup. To
in scaleup with the same fluid. Therefore, we must choose
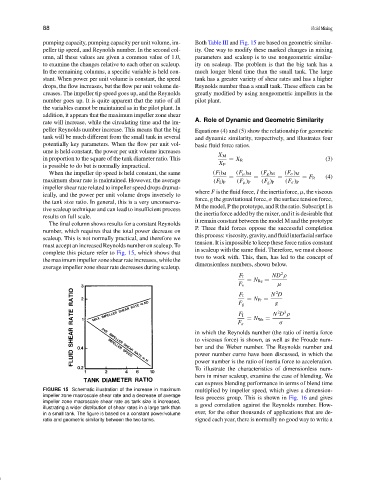
complete this picture refer to Fig. 15, which shows that
two to work with. This, then, has led to the concept of
the maximum impeller zone shear rate increases, while the
dimensionless numbers, shown below.
average impeller zone shear rate decreases during scaleup.
2
F I ND ρ
= N Re =
F v µ
2
F I N D
= N Fr =
F g g
2
3
N D ρ
F I
= N We =
F σ σ
in which the Reynolds number (the ratio of inertia force
to viscosus force) is shown, as well as the Froude num-
ber and the Weber number. The Reynolds number and
power number curve have been discussed, in which the
power number is the ratio of inertia force to acceleration.
To illustrate the characteristics of dimensionless num-
bers in mixer scaleup, examine the case of blending. We
can express blending performance in terms of blend time
FIGURE 15 Schematic illustration of the increase in maximum multiplied by impeller speed, which gives a dimension-
impeller zone macroscale shear rate and a decrease of average less process group. This is shown in Fig. 16 and gives
impeller zone macroscale shear rate as tank size is increased,
illustrating a wider distribution of shear rates in a large tank than a good correlation against the Reynolds number. How-
in a small tank. The figure is based on a constant power/volume ever, for the other thousands of applications that are de-
ratio and geometric similarity between the two tanks. signed each year, there is normally no good way to write a