
Page 293 - Academic Press Encyclopedia of Physical Science and Technology 3rd Chemical Engineering
P. 293
P1: FYK/LPB P2: FPP Final
Encyclopedia of Physical Science and Technology EN006C-252 June 27, 2001 14:15
Fluid Mixing 93
coefficient K G a can entirely supercede any requirement
for a particular type of visual description of the gas–liquid
dispersion. In general, linear gas superficial velocity, nor-
mally given the symbol F, in feet per second, is based on
dividing the tank cross-sectional area by the flow of gas
at the temperature and pressure of the gas at the midpoint
of the tank. This quantity is very basic both in the scaleup
correlation and in predicting the power imparted to the
liquid by the gas stream.
It is characteristic that this ratio F increases on scaleup,
since if we maintain equal volumes of gas per volume of
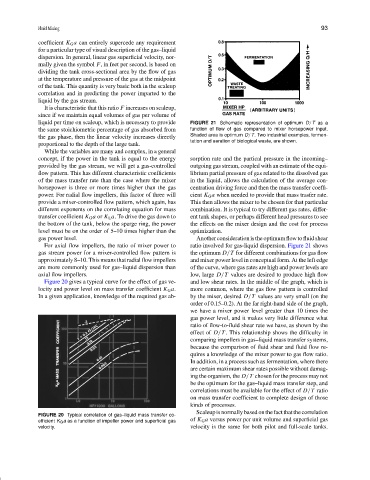
liquid per time on scaleup, which is necessary to provide FIGURE 21 Schematic representation of optimum D /T as a
the same stoichiometric percentage of gas absorbed from function of flow of gas compared to mixer horsepower input.
the gas phase, then the linear velocity increases directly Shaded area is optimum D /T. Two industrial examples, fermen-
tation and aeration of biological waste, are shown.
proportional to the depth of the large tank.
While the variables are many and complex, in a general
concept, if the power in the tank is equal to the energy sorption rate and the partical pressure in the incoming–
provided by the gas stream, we will get a gas-controlled outgoing gas stream, coupled with an estimate of the equi-
flow pattern. This has different characteristic coefficients librium partial pressure of gas related to the dissolved gas
of the mass transfer rate than the case where the mixer in the liquid, allows the calculation of the average con-
horsepower is three or more times higher than the gas centration driving force and then the mass transfer coeffi-
power. For radial flow impellers, this factor of three will cient K G a when needed to provide that mass trasfer rate.
provide a mixer-controlled flow pattern, which again, has This then allows the mixer to be chosen for that particular
different exponents on the correlating equation for mass combination. It is typical to try different gas rates, differ-
transfer coefficient K G a or K L a. To drive the gas down to ent tank shapes, or perhaps different head pressures to see
the bottom of the tank, below the sparge ring, the power the effects on the mixer design and the cost for process
level must be on the order of 5–10 times higher than the optimization.
gas power level. Anotherconsiderationistheoptimumflow to fluidshear
For axial flow impellers, the ratio of mixer power to ratio involved for gas-liquid dispersion. Figure 21 shows
gas stream power for a mixer-controlled flow pattern is the optimum D/T for different combinations for gas flow
approximately 8–10. This means that radial flow impellers and mixer power level in conceptual form. At the left edge
are more commonly used for gas–liquid dispersion than of the curve, where gas rates are high and power levels are
axial flow impellers. low, large D/T values are desired to produce high flow
Figure 20 gives a typical curve for the effect of gas ve- and low shear rates. In the middle of the graph, which is
locity and power level on mass transfer coefficient K G a. more common, where the gas flow pattern is controlled
In a given application, knowledge of the required gas ab- by the mixer, desired D/T values are very small (on the
order of 0.15–0.2). At the far right-hand side of the graph,
we have a mixer power level greater than 10 times the
gas power level, and it makes very little difference what
ratio of flow-to-fluid shear rate we have, as shown by the
effect of D/T . This relationship shows the difficulty in
comparing impellers in gas–liquid mass transfer systems,
because the comparison of fluid shear and fluid flow re-
quires a knowledge of the mixer power to gas flow ratio.
In addition, in a process such as fermentation, where there
are certain maximum shear rates possible without damag-
ing the organism, the D/T chosen for the process may not
be the optimum for the gas–liquid mass transfer step, and
correlations must be available for the effect of D/T ratio
on mass transfer coefficient to complete design of those
kinds of processes.
Scaleupisnormallybasedonthefactthatthecorrelation
FIGURE 20 Typical correlation of gas–liquid mass transfer co-
efficient K G a as a function of impeller power and superficial gas of K G a versus power per unit volume and superficial gas
velocity. velocity is the same for both pilot and full-scale tanks.