
Page 345 - Academic Press Encyclopedia of Physical Science and Technology 3rd Analytical Chemistry
P. 345
P1: GNH/FEE P2: GPJ Final Pages
Encyclopedia of Physical Science and Technology EN010C-493 July 19, 2001 20:30
710 Nuclear Magnetic Resonance (NMR)
possible to uniformly excite all of the nuclei in a liquid (bottom), its carbon framework structure, and the time de-
sample in an NMR experiment. The result is that the total cay of the magnetization under a pulse NMR experiment
nuclear magnetization observed in an NMR experiment is (see Section IV) used to obtain the spectrum in the Fourier
proportional to the number of the nuclei in each chemical transform mode. We shall have more to say about pulse
environment in all molecules under observation. Such is and Fourier transform NMR in a bit; for the moment, just
not the case for spectroscopies between the infrared and concentrate on the spectrum and the structure. This struc-
ultraviolet regions of radiation, which monitor rotational, ture has four methyne bridgehead carbons, H C, and six
vibrational, and electronic energy levels in molecules. methylene carbons, CH 2 . A quantitative analysis of the
In these spectroscopies, different chemical functionalities areas of the two peaks shows that the areas are in the
within a given molecule can have vastly different transi- ratios 4:6, or 2:3, the same ratio as for the numbers of
tion probabilities (i.e., extinction coefficients). This is the carbons with the chemical identification indicated.
reason such spectroscopies, while diagnostic qualitative The 13 C NMR spectrum shown for adamantane in
tools, are not convenient quantitative tools without exten- Fig. 2a has been deliberately broadened to illustrate just
sive calibration procedures. the chemical shift spectrum in the absence of scalar cou-
In addition, for NMR of liquid samples, again unlike pling. Nevertheless, one sees that the two peaks are 10
visibleabsorptionspectroscopies,thespectraofmolecules ppm apart, with widths of roughly 5 ppm. This is quite
are especially simple and easy to interpret. For example, a fantastic resolution, being able to see differences in ab-
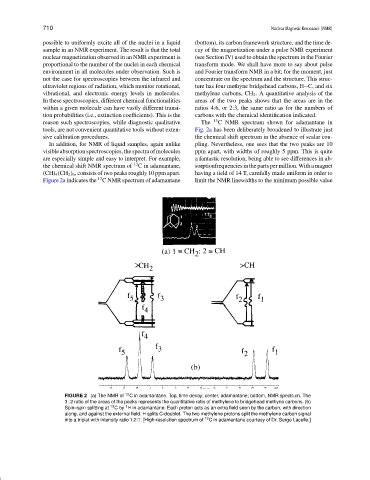
the chemical shift NMR spectrum of 13 C in adamantane, sorptionfrequenciesin the parts per million. With amagnet
(CH) 4 (CH 2 ) 6 , consists of two peaks roughly 10 ppm apart. having a field of 14 T, carefully made uniform in order to
13
Figure 2a indicates the C NMR spectrum of adamantane limit the NMR linewidths to the minimum possible value
FIGURE 2 (a) The NMR of 13 C in adamantane. Top, time decay; center, adamantane; bottom, NMR spectrum. The
3 : 2 ratio of the areas of the peaks represents the quantitative ratio of methylene to bridgehead methyne carbons. (b)
1
Spin–spin splitting at 13 Cby H in adamantane. Each proton acts as an extra field seen by the carbon, with direction
along, and against the external field. H splits C-doublet. The two methylene protons split the methylene carbon signal
into a triplet with intensity ratio 1:2:1. [High-resolution spectrum of 13 C in adamantane courtesy of Dr. Serge Lacelle.]