
Page 349 - Academic Press Encyclopedia of Physical Science and Technology 3rd Analytical Chemistry
P. 349
P1: GNH/FEE P2: GPJ Final Pages
Encyclopedia of Physical Science and Technology EN010C-493 July 19, 2001 20:30
714 Nuclear Magnetic Resonance (NMR)
1
∞
S(ω) = π dt S(t) exp[−iωt].
2 0
A tremendous advantage of pulse and Fourier transform
NMR is the fact that the spectral width scanned in a sin-
1
gle pulse of pulse width t p is roughly t p . For example, a
2
pulse a microsecond long has a spectral width of 500 KHz,
meaning that all nuclei with resonant frequencies 250 KHz
on each side of the central carrier frequency will be equally
excited, and will experience resonant transitions. This fact
has potent implications in obtaining spectra by signal aver-
aging because an entire spectrum can be scanned in very
few seconds for many nuclei. It is now possible, using
transient techniques, to obtain spectra of nuclei simply
unavailable in the past, and at the time of the present writ-
ing, almost every nucleus in the periodic table is available
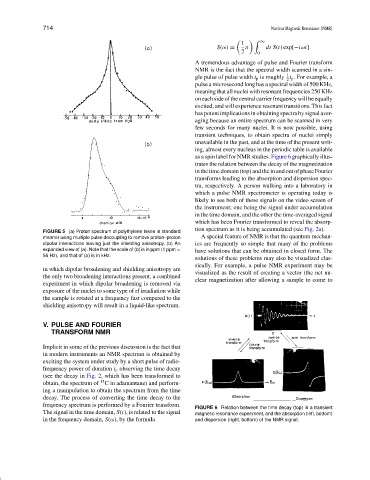
as a spin label for NMR studies. Figure 6 graphically illus-
trates the relation between the decay of the magnetization
in the time domain (top) and the in and out of phase Fourier
transforms leading to the absorption and dispersion spec-
tra, respectively. A person walking into a laboratory in
which a pulse NMR spectrometer is operating today is
likely to see both of these signals on the video screen of
the instrument; one being the signal under accumulation
in the time domain, and the other the time-averaged signal
which has been Fourier transformed to reveal the absorp-
tion spectrum as it is being accumulated (see Fig. 2a).
FIGURE 5 (a) Proton spectrum of polythylene taken in standard
manner using multiple pulse decoupling to remove proton–proton A special feature of NMR is that the quantum mechan-
dipolar interactions leaving just the shielding anisotropy. (b) An ics are frequently so simple that many of the problems
have solutions that can be obtained in closed form. The
expanded view of (a). Note that the scale of (b) is in ppm (1 ppm =
56 Hz), and that of (a) is in kHz.
solutions of these problems may also be visualized clas-
sically. For example, a pulse NMR experiment may be
in which dipolar broadening and shielding anisotropy are
visualized as the result of creating a vector (the net nu-
the only two broadening interactions present, a combined
clear magnetization after allowing a sample to come to
experiment in which dipolar broadening is removed via
exposure of the nuclei to some type of rf irradiation while
the sample is rotated at a frequency fast compared to the
shielding anisotropy will result in a liquid-like spectrum.
V. PULSE AND FOURIER
TRANSFORM NMR
Implicit in some of the previous discussion is the fact that
in modern instruments an NMR spectrum is obtained by
exciting the system under study by a short pulse of radio-
frequency power of duration t p observing the time decay
(see the decay in Fig. 2, which has been transformed to
obtain, the spectrum of 13 C in adamantane) and perform-
ing a manipulation to obtain the spectrum from the time
decay. The process of converting the time decay to the
frequency spectrum is performed by a Fourier transform.
FIGURE 6 Relation between the time decay (top) in a transient
The signal in the time domain, S(t), is related to the signal magnetic resonance experiment, and the absorption (left, bottom)
in the frequency domain, S(ω), by the formula and dispersion (right, bottom) of the NMR signal.