
Page 77 - Academic Press Encyclopedia of Physical Science and Technology 3rd Polymer
P. 77
P1: GQT/LBX P2: GQT/MBQ QC: FYD Final Pages
Encyclopedia of Physical Science and Technology EN008C-602 July 25, 2001 20:31
892 Macromolecules, Structure
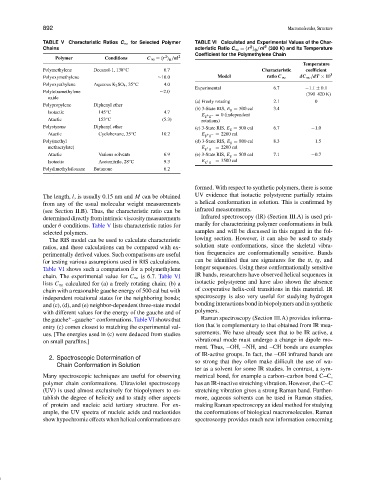
TABLE V Characteristic Ratios C ∞ for Selected Polymer TABLE VI Calculated and Experimental Values of the Char-
2
2
Chains acteristic Ratio C ∞ = r /nl (300 K) and Its Temperature
0
Coefficient for the Polymethylene Chain
2
Polymer Conditions C ∞ = r /nl 2
0
Temperature
Polymethylene Decanol-1, 138 C 6.7 Characteristic coefficient
◦
Polyoxymethylene ∼10.0 Model ratio C ∞ dC ∞ /dT × 10 3
Polyoxyethylene Aqueous K 2 SO 4 , 35 C 4.0
◦
Experimental 6.7 −1.1 ± 0.1
Polytetramethylene ∼2.0 (390–420 K)
oxide
(a) Freely rotating 2.1 0
Polypropylene Diphenyl ether
(b) 3-State RIS, E g = 500 cal 3.4
◦
Isotactic 145 C 4.7
E g + g − = 0 (independent
Atactic 153 C (5.3) rotations)
◦
Polystyrene Diphenyl ether (c) 3-State RIS, E g = 500 cal 6.7 −1.0
Atactic Cyclohexane, 35 C 10.2 E g + g − = 2200 cal
◦
Poly(methyl (d) 3-State RIS, E g = 800 cal 8.3 −1.5
methacrylate) E g + g − = 2200 cal
Atactic Various solvents 6.9 (e) 3-State RIS, E g = 500 cal 7.1 −0.7
Isotactic Acetonitrile, 28 C 9.3 E g + g − = 3500 cal
◦
Polydimethylsiloxane Butanone 6.2
formed. With respect to synthetic polymers, there is some
The length, l, is usually 0.15 nm and M can be obtained UV evidence that isotactic polystyrene partially retains
from any of the usual molecular weight measurements a helical conformation in solution. This is confirmed by
(see Section II.B). Thus, the characteristic ratio can be infrared measurements.
determineddirectlyfromintrinsicviscositymeasurements Infrared spectroscopy (IR) (Section III.A) is used pri-
under θ conditions. Table V lists characteristic ratios for marily for characterizing polymer conformations in bulk
selected polymers. samples and will be discussed in this regard in the fol-
The RIS model can be used to calculate characteristic lowing section. However, it can also be used to study
ratios, and these calculations can be compared with ex- solution state conformations, since the skeletal vibra-
perimentally derived values. Such comparisons are useful tion frequencies are conformationally sensitive. Bands
for testing various assumptions used in RIS calculations. can be identified that are signatures for the tt, tg, and
Table VI shows such a comparison for a polymethylene longer sequences. Using these conformationally sensitive
chain. The experimental value for C ∞ is 6.7. Table VI IR bands, researchers have observed helical sequences in
lists C ∞ calculated for (a) a freely rotating chain; (b) a isotactic polystyrene and have also shown the absence
chain with a reasonable gauche energy of 500 cal but with of cooperative helix-coil transitions in this material. IR
independent rotational states for the neighboring bonds; spectroscopy is also very useful for studying hydrogen
and (c), (d), and (e) neighbor-dependent three-state model bonding interactions bond in biopolymers and in synthetic
with different values for the energy of the gauche and of polymers.
− Raman spectroscopy (Section III.A) provides informa-
the gauche –gauche conformations. Table VI shows that
+
entry (c) comes closest to matching the experimental val- tion that is complementary to that obtained from IR mea-
ues. [The energies used in (c) were deduced from studies surements. We have already seen that to be IR active, a
on small paraffins.] vibrational mode must undergo a change in dipole mo-
ment. Thus, OH, NH, and CH bonds are examples
of IR-active groups. In fact, the OH infrared bands are
2. Spectroscopic Determination of
Chain Conformation in Solution so strong that they often make difficult the use of wa-
ter as a solvent for some IR studies. In contrast, a sym-
Many spectroscopic techniques are useful for observing metrical bond, for example a carbon–carbon bond C C,
polymer chain conformations. Ultraviolet spectroscopy has an IR-inactive stretching vibration. However, the C C
(UV) is used almost exclusively for biopolymers to es- stretching vibration gives a strong Raman band. Further-
tablish the degree of helicity and to study other aspects more, aqueous solvents can be used in Raman studies,
of protein and nucleic acid tertiary structure. For ex- making Raman spectroscopy an ideal method for studying
ample, the UV spectra of nucleic acids and nucleotides the conformations of biological macromolecules. Raman
show hypochromic effects when helical conformations are spectroscopy provides much new information concerning