
Page 97 - Academic Press Encyclopedia of Physical Science and Technology 3rd InOrganic Chemistry
P. 97
P1: GLM/GLT P2: FQP Final Pages
Encyclopedia of Physical Science and Technology En004F-171 June 8, 2001 17:11
364 Dielectric Gases
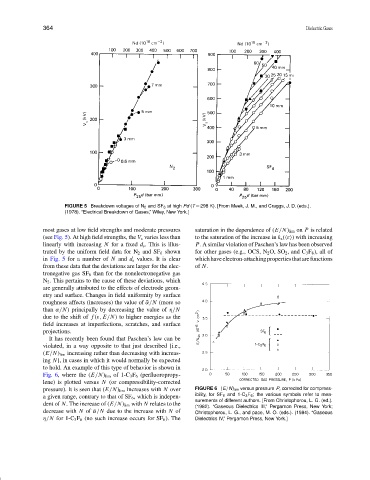
FIGURE 5 Breakdown voltages of N 2 and SF 6 at high Pd (T = 298 K). [From Meek, J. M., and Craggs, J. D. (eds.).
(1978). “Electrical Breakdown of Gases,” Wiley, New York.]
most gases at low field strengths and moderate pressures saturation in the dependence of (E/N) lim on P is related
(see Fig. 5). At high field strengths, the V s varies less than to the saturation of the increase in k a ( ε ) with increasing
linearly with increasing N for a fixed d s . This is illus- P. A similar violation of Paschen’s law has been observed
trated by the uniform field data for N 2 and SF 6 shown for other gases (e.g., OCS, N 2 O, SO 2 , and C 3 F 8 ), all of
in Fig. 5 for a number of N and d s values. It is clear whichhaveelectron-attachingpropertiesthatarefunctions
from these data that the deviations are larger for the elec- of N.
tronegative gas SF 6 than for the nonelectronegative gas
N 2 . This pertains to the cause of these deviations, which
are generally attributed to the effects of electrode geom-
etry and surface. Changes in field uniformity by surface
roughness affects (increases) the value of ¯α/N (more so
than α/N) principally by decreasing the value of η/N
due to the shift of f (ε, E /N) to higher energies as the
field increases at imperfections, scratches, and surface
projections.
It has recently been found that Paschen’s law can be
violated, in a way opposite to that just described [i.e.,
(E /N) lim increasing rather than decreasing with increas-
ing N], in cases in which it would normally be expected
to hold. An example of this type of behavior is shown in
Fig. 6, where the (E /N) lim of 1-C 3 F 6 (perfluoropropy-
lene) is plotted versus N (or compressibility-corrected
pressure). It is seen that (E/N) lim increases with N over FIGURE 6 (E/N) lim versus pressure P, corrected for compress-
a given range, contrary to that of SF 6 , which is indepen- ibility, for SF 6 and 1-C 3 F 6 ; the various symbols refer to mea-
surements of different authors. [From Christophorou, L. G. (ed.).
dent of N. The increase of (E/N) lim with N relates to the
(1982). “Gaseous Dielectrics III,” Pergamon Press, New York;
decrease with N of ¯α/N due to the increase with N of Christophorou, L. G., and pace, M. O. (eds.). (1984). “Gaseous
η/N for 1-C 3 F 6 (no such increase occurs for SF 6 ). The Dielectrics IV,” Pergamon Press, New York.]