
Page 49 - Subyek Encyclopedia - Encyclopedia of Separation Science
P. 49
44 I / CHROMATOGRAPHY/ Derivatization
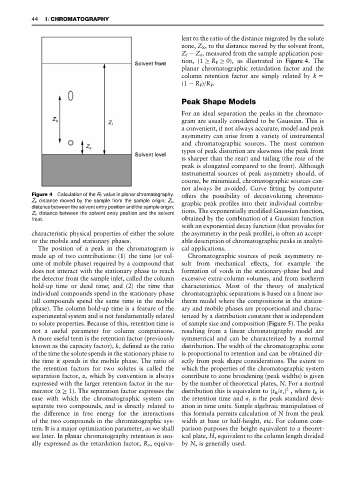
lent to the ratio of the distance migrated by the solute
zone, Z X , to the distance moved by the solvent front,
Z f !Z 0 , measured from the sample application posi-
tion, (15R F 50), as illustrated in Figure 4. The
planar chromatographic retardation factor and the
column retention factor are simply related by k"
(1!R F )/R F .
Peak Shape Models
For an ideal separation the peaks in the chromato-
gram are usually considered to be Gaussian. This is
a convenient, if not always accurate, model and peak
asymmetry can arise from a variety of instrumental
and chromatographic sources. The most common
types of peak distortion are skewness (the peak front
is sharper than the rear) and tailing (the rear of the
peak is elongated compared to the front). Although
instrumental sources of peak asymmetry should, of
course, be minimized, chromatographic sources can-
not always be avoided. Curve Rtting by computer
Figure 4 Calculation of the R F value in planar chromatography. offers the possibility of deconvoluting chromato-
Z X distance moved by the sample from the sample origin; Z 0 ,
graphic peak proRles into their individual contribu-
distance between the solvent entry position and the sample origin;
Z f , distance between the solvent entry position and the solvent tions. The exponentially modiRed Gaussian function,
front. obtained by the combination of a Gaussian function
with an exponential decay function (that provides for
characteristic physical properties of either the solute the asymmetry in the peak proRle), is often an accept-
or the mobile and stationary phases. able description of chromatographic peaks in analyti-
The position of a peak in the chromatogram is cal applications.
made up of two contributions: (1) the time (or vol- Chromatographic sources of peak asymmetry re-
ume of mobile phase) required by a compound that sult from mechanical effects, for example the
does not interact with the stationary phase to reach formation of voids in the stationary-phase bed and
the detector from the sample inlet, called the column excessive extra-column volumes, and from isotherm
hold-up time or dead time; and (2) the time that characteristics. Most of the theory of analytical
individual compounds spend in the stationary phase chromatographic separations is based on a linear iso-
(all compounds spend the same time in the mobile therm model where the compositions in the station-
phase). The column hold-up time is a feature of the ary and mobile phases are proportional and charac-
experimental system and is not fundamentally related terized by a distribution constant that is independent
to solute properties. Because of this, retention time is of sample size and composition (Figure 5). The peaks
not a useful parameter for column comparisons. resulting from a linear chromatography model are
A more useful term is the retention factor (previously symmetrical and can be characterized by a normal
known as the capacity factor), k,deRned as the ratio distribution. The width of the chromatographic zone
of the time the solute spends in the stationary phase to is proportional to retention and can be obtained dir-
the time it spends in the mobile phase. The ratio of ectly from peak shape considerations. The extent to
the retention factors for two solutes is called the which the properties of the chromatographic system
separation factor, , which by convention is always contribute to zone broadening (peak widths) is given
expressed with the larger retention factor in the nu- by the number of theoretical plates, N. For a normal
2
merator ( 51). The separation factor expresses the distribution this is equivalent to (t R / t ) , where t R is
ease with which the chromatographic system can the retention time and t is the peak standard devi-
separate two compounds, and is directly related to ation in time units. Simple algebraic manipulation of
the difference in free energy for the interactions this formula permits calculation of N from the peak
of the two compounds in the chromatographic sys- width at base or half-height, etc. For column com-
tem. It is a major optimization parameter, as we shall parison purposes the height equivalent to a theoret-
see later. In planar chromatography retention is usu- ical plate, H, equivalent to the column length divided
ally expressed as the retardation factor, R F , equiva- by N, is generally used.