
Page 52 - Subyek Encyclopedia - Encyclopedia of Separation Science
P. 52
Sepsci*21*TSK*Venkatachala=BG
I / CHROMATOGRAPHY 47
is given by: minimized by using particles of small diameter with
a narrow particle size distribution in columns with
u" E/4 [2] a high and homogeneous packing density. For open-
tubular columns, Sow anisotropy is not a contribu-
where is the solution dielectric constant, is the zeta ting factor since the streamlines have no obstacles in
potential (potential at the boundary between the their way to cause disruption of the sample proRle.
charged surface and the start of the diffuse part Axial diffusion is the natural tendency of sol-
of the double layer), and E is the electric Reld ute molecules in the mobile phase to redistribute
strength. Note that there is no explicit dependence on themselves by diffusion from a region of high con-
the particle size and column length, which limit the centration to one of lower concentration. Its contri-
total efRciency of columns when the Sow is pneu- bution to zone broadening depends on the solute
matically driven. The column length and column in- diffusion coefRcient in the mobile phase and
ternal diameter, however, cannot be treated as inde- the column residence time. Diffusion of solute
pendent variables in MEKC and CEC, but are related molecules occurs in all directions but only the compo-
through Joule heating of the electrolyte and its ef- nents in the plane of mobile-phase migration contrib-
fect on the mobile-phase Sow proRle. Heat is gener- utes to the peak proRle observed in the chromatogram.
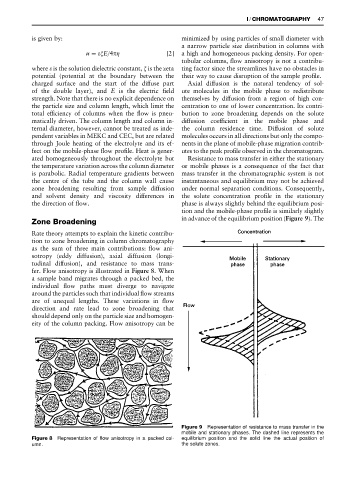
ated homogeneously throughout the electrolyte but Resistance to mass transfer in either the stationary
the temperature variation across the column diameter or mobile phases is a consequence of the fact that
is parabolic. Radial temperature gradients between mass transfer in the chromatographic system is not
the centre of the tube and the column wall cause instantaneous and equilibrium may not be achieved
zone broadening resulting from sample diffusion under normal separation conditions. Consequently,
and solvent density and viscosity differences in the solute concentration proRle in the stationary
the direction of Sow. phase is always slightly behind the equilibrium posi-
tion and the mobile-phase proRle is similarly slightly
in advance of the equilibrium position (Figure 9). The
Zone Broadening
Rate theory attempts to explain the kinetic contribu-
tion to zone broadening in column chromatography
as the sum of three main contributions: Sow ani-
sotropy (eddy diffusion), axial diffusion (longi-
tudinal diffusion), and resistance to mass trans-
fer. Flow anisotropy is illustrated in Figure 8. When
a sample band migrates through a packed bed, the
individual Sow paths must diverge to navigate
around the particles such that individual Sow streams
are of unequal lengths. These variations in Sow
direction and rate lead to zone broadening that
should depend only on the particle size and homogen-
eity of the column packing. Flow anisotropy can be
Figure 9 Representation of resistance to mass transfer in the
mobile and stationary phases. The dashed line represents the
Figure 8 Representation of flow anisotropy in a packed col- equilibrium position and the solid line the actual position of
umn. the solute zones.