
Page 53 - Subyek Encyclopedia - Encyclopedia of Separation Science
P. 53
48 I / CHROMATOGRAPHY/ Derivatization
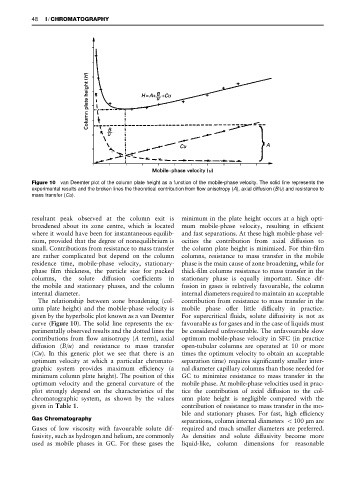
Figure 10 van Deemter plot of the column plate height as a function of the mobile-phase velocity. The solid line represents the
experimental results and the broken lines the theoretical contribution from flow anisotropy (A), axial diffusion (B/u) and resistance to
mass transfer (Cu).
resultant peak observed at the column exit is minimum in the plate height occurs at a high opti-
broadened about its zone centre, which is located mum mobile-phase velocity, resulting in efRcient
where it would have been for instantaneous equilib- and fast separations. At these high mobile-phase vel-
rium, provided that the degree of nonequilibrium is ocities the contribution from axial diffusion to
small. Contributions from resistance to mass transfer the column plate height is minimized. For thin-Rlm
are rather complicated but depend on the column columns, resistance to mass transfer in the mobile
residence time, mobile-phase velocity, stationary- phase is the main cause of zone broadening, while for
phase Rlm thickness, the particle size for packed thick-Rlm columns resistance to mass transfer in the
columns, the solute diffusion coefRcients in stationary phase is equally important. Since dif-
the mobile and stationary phases, and the column fusion in gases is relatively favourable, the column
internal diameter. internal diameters required to maintain an acceptable
The relationship between zone broadening (col- contribution from resistance to mass transfer in the
umn plate height) and the mobile-phase velocity is mobile phase offer little difRculty in practice.
given by the hyperbolic plot known as a van Deemter For supercritical Suids, solute diffusivity is not as
curve (Figure 10). The solid line represents the ex- favourable as for gases and in the case of liquids must
perimentally observed results and the dotted lines the be considered unfavourable. The unfavourable slow
contributions from Sow anisotropy (A term), axial optimum mobile-phase velocity in SFC (in practice
diffusion (B/u) and resistance to mass transfer open-tubular columns are operated at 10 or more
(Cu). In this generic plot we see that there is an times the optimum velocity to obtain an acceptable
optimum velocity at which a particular chromato- separation time) requires signiRcantly smaller inter-
graphic system provides maximum efRciency (a nal diameter capillary columns than those needed for
minimum column plate height). The position of this GC to minimize resistance to mass transfer in the
optimum velocity and the general curvature of the mobile phase. At mobile-phase velocities used in prac-
plot strongly depend on the characteristics of the tice the contribution of axial diffusion to the col-
chromatographic system, as shown by the values umn plate height is negligible compared with the
given in Table 1. contribution of resistance to mass transfer in the mo-
bile and stationary phases. For fast, high efRciency
Gas Chromatography separations, column internal diameters (100 mare
Gases of low viscosity with favourable solute dif- required and much smaller diameters are preferred.
fusivity, such as hydrogen and helium, are commonly As densities and solute diffusivity become more
used as mobile phases in GC. For these gases the liquid-like, column dimensions for reasonable