
Page 274 - Engineered Interfaces in Fiber Reinforced Composites
P. 274
Chapter 6. Interface mechanics and fracture toughness theories 255
6.3.1. Continuous jiber composites
Once the characteristic -&I, lpo values and other important parameters, such as the
fiber debond and pull-out stresses, are estimated from the known properties of
composite constituents, the total fracture toughness for composites can be predicted
based on the three principal failure mechanisms, i.e. interfacial debonding, stress
redistribution and fiber pull-out (Beaumont and Anstice, 1980; Anstice and
Beaumont, 1981; Wells and Beaumont, 1985). Matrix fracture energy and post-
debonding friction are also considered in their earlier work (Wells and Beaumont,
1982). Fracture toughness equations have been modified taking into account the
matrix shrinkage stress. Also considered are the non-linear fiber stress distributions
between the debond crack front and matrix fracture plane before and after fiber
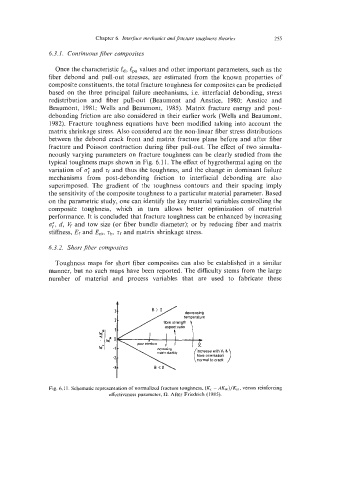
fracture and Poisson contraction during fiber pull-out. The effect of two simulta-
neously varying parameters on fracture toughness can be clearly studied from the
typical toughness maps shown in Fig. 6.1 1. The effect of hygrothermal aging on the
variation of or and zf and thus the toughness, and the change in dominant failure
mechanisms from post-debonding friction to interfacial debonding are also
superimposed. The gradient of the toughness contours and their spacing imply
the sensitivity of the composite toughness to a particular material parameter. Based
on the parametric study, one can identify the key material variables controlling the
composite toughness, which in turn allows better optimization of material
performance. It is concluded that fracture toughness can be enhanced by increasing
OF, d, vf and tow size (or fiber bundle diameter); or by reducing fiber and matrix
stiffness, Ef and E,,,, Zb, zf and matrix shrinkage stress.
6.3.2. Short ,fiber composites
Toughness maps for short fiber composites can also be established in a similar
manner, but no such maps have been reported. The difficulty stems from the large
number of material and process variables that are used to fabricate these
normal to crack
Fig. 6.1 1. Schematic representation of normalized fracture toughness, (K, - AKm)/Km, versus reinforcing
cffcctivcness parameter, a. After Friedrich (1985).