
Page 275 - Engineered Interfaces in Fiber Reinforced Composites
P. 275
256 Engineered interfaces in $fiber reinforced composites
composites. Nonetheless, if one can identify a dominant failure mechanism for a
given composite system, the fracture toughness may be directly related to the
properties of the composite constituents and the interface as well as other variables.
For example, in injection molded CFRPs and GFRPs containing thermoplastic
matrices where matrix fracture dominates the total fracture toughness, Kc is shown
to be a linear function of the parameters, Km and Q, according to Eq. (6.15)
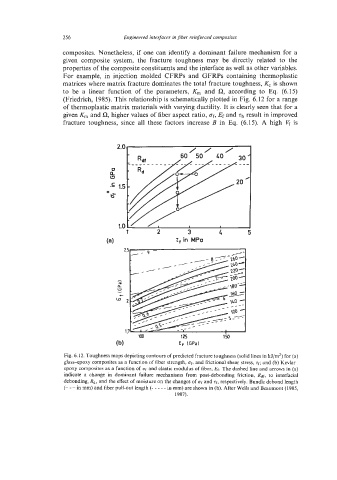
(Friedrich, 1985). This relationship is schematically plotted in Fig. 6.12 for a range
of thermoplastic matrix materials with varying ductility. It is clearly seen that for a
given K, and R, higher values of fiber aspect ratio, of, Ef and Tb result in improved
fracture toughness, since all these factors increase B in Eq. (6.15). A high vf is
//
60 50 LO 30’
1 2 3 4 5
(a) T‘ in MPa
2.5
/- 9-
la, 12S 150
(b) Ef IGPa)
Fig. 6.12. Toughness maps depicting contours of predicted fracture toughness (solid lines in kJ/m2) for (a)
glass-epoxy composites as a function of fiber strength, uf, and frictional shear stress, tf; and (b) Kevlar-
epoxy composites as a function of ur and clastic modulus of fiber, Ef. The dashed line and arrows in (a)
indicate a change in dominant failure mechanisms from post-debonding friction, &, to interfacial
debonding, Rd, and the effect of moisture on the changes of of and rr, respectively. Bundle debond length
(- --in mm) and fiber pull-out length (- - - - - in mm) are shown in (b). After Wells and Beaumont (1985,
1987).