
Page 38 - Engineered Interfaces in Fiber Reinforced Composites
P. 38
Chapter 2. Characterization of interfaces 21
Table 2.4 (Contd.)
Technique Atomic process and type of information
~
Nuclear magnetic resonance In NMR technique, a sample is placed in a magnetic field which forccs thc
(NMR) spectroscopy nuclei into alignment. When the sample is bombarded with radiowaves,
they are absorbed by the nuclei. The nuclei topple out of alignment with
the magnetic field. By measuring the specific radiofrequencies that are
emitted by the nuclei and the rate at which the rcalignment occurs, the
spectroscope can obtain the information on molecular structure.
"After Adamson (1982), Lee (1989) and Ishida (1994)
of adsorption on surfaces of polymers (Lee, 1991) and of chemical modification and
irradiation of polymers on the fiber surfaces, including silane treated glass fibers
(Ishida and Koenig, 1980; Garton and Daly, 1985; Grap et al., 1985; Miller and
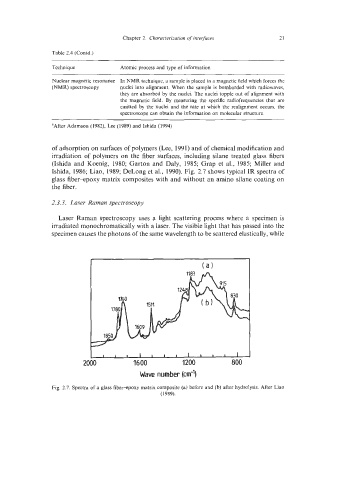
Ishida, 1986; Liao, 1989; DeLong et al., 1990). Fig. 2.7 shows typical IR spectra of
glass fiber-epoxy matrix composites with and without an amino silane coating on
the fiber.
2.3.3. Laser Raman spectroscopy
Laser Raman spectroscopy uses a light scattering process where a specimen is
irradiated monochromatically with a laser. The visible light that has passed into the
specimen causes the photons of the same wavelength to be scattered elastically, while
I 1 1 1 1 1 1 1 1
2000 1600 1200 800
Wave number (cm-'1
Fig. 2.7. Spectra of a glass fiber-epoxy matrix composite (a) before and (b) after hydrolysis. After Liao
(1989).