
Page 66 - Engineered Interfaces in Fiber Reinforced Composites
P. 66
Chapter 3. Measurements of interfacelinterlaminar properties 49
TI
l-uduuL
‘5 8 8.5 9 9.5 1
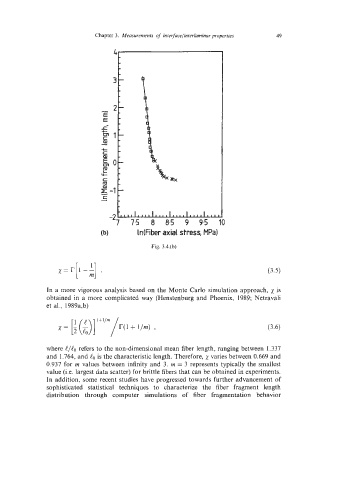
Idfiber axial stress, MPa)
Fig. 3.4.(b)
[ :I
x=~i-- . (3-5)
In a more vigorous analysis based on the Monte Carlo simulation approach, x is
obtained in a more complicated way (Henstenburg and Phoenix, 1989; Netravali
et al., 1989a,b)
x = [; (31 l+”m/r(l + l/m) ,
where l/lo refers to the non-dimensional mean fiber length, ranging between 1.337
and 1.764, and lo is the characteristic length. Therefore, varies between 0.669 and
0.937 for m values between infinity and 3. m = 3 represents typically the smallest
value (Le. largest data scatter) for brittle fibers that can be obtained in experiments.
In addition, some recent studies have progressed towards further advancement of
sophisticated statistical techniques to characterize the fiber fragment length
distribution through computer simulations of fiber fragmentation behavior