
Page 80 - Engineered Interfaces in Fiber Reinforced Composites
P. 80
Chapter 3. Measurements of interfacelinterlamimar properties 63
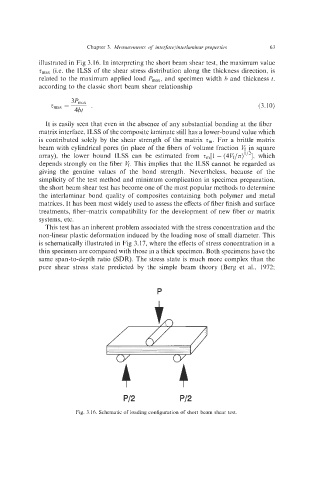
illustrated in Fig 3.16. In interpreting the short beam shear test, the maximum value
T~~~ (Le. the ILSS of the shear stress distribution along the thickness direction, is
related to the maximum applied load Pmax, and specimen width b and thickness t,
according to the classic short beam shear relationship
3Pmax
Tmax = - (3.10)
4bt
It is easily seen that even in the absence of any substantial bonding at the fiber-
matrix interface, ILSS of the composite laminate still has a lower-bound value which
is contributed solely by the shear strength of the matrix 7,. For a brittle matrix
beam with cylindrical pores (in place of the fibers of volume fraction vf in square
array), the lower bound ILSS can be estimated from zm[l - (4vf/~)~’~], which
depends strongly on the fiber vf. This implies that the ILSS cannot be regarded as
giving the genuine values of the bond strength. Nevertheless, because of the
simplicity of the test method and minimum complication in specimen preparation,
the short beam shear test has become one of the most popular methods to determine
the interlaminar bond quality of composites containing both polymer and metal
matrices. It has been most widely used to assess the effects of fiber finish and surface
treatments, fiber-matrix compatibility for the development of new fiber or matrix
systems, etc.
This test has an inherent problem associated with the stress concentration and the
non-linear plastic deformation induced by the loading nose of small diameter. This
is schematically illustrated in Fig 3.17, where the effects of stress concentration in a
thin specimen are compared with those in a thick specimen. Both specimens have the
same span-to-depth ratio (SDR). The stress state is much more complex than the
pure shear stress state predicted by the simple beam theory (Berg et al., 1972;
P
p/2 p/2
Fig. 3.16. Schematic of loading configuration of short beam shear test.