
Page 168 - Engineering Digital Design
P. 168
4.3 INTRODUCTION TO LOGIC FUNCTION GRAPHICS 139
A B
0 0 AB = m 0
0 1 AB = m 1
1 0 AB = m 2
1 1 AB = m,
Minterm code
numbers
(a) (b) (c)
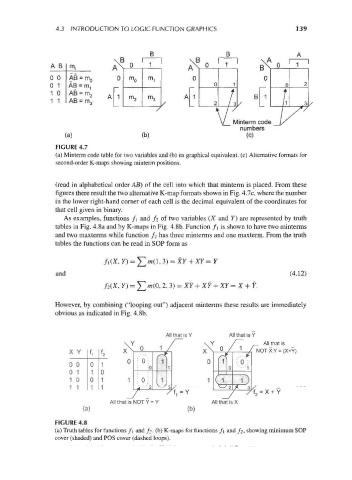
FIGURE 4.7
(a) Minterm code table for two variables and (b) its graphical equivalent, (c) Alternative formats for
second-order K-maps showing minterm positions.
(read in alphabetical order AB) of the cell into which that minterm is placed. From these
figures there result the two alternative K-map formats shown in Fig. 4.7c, where the number
in the lower right-hand corner of each cell is the decimal equivalent of the coordinates for
that cell given in binary.
As examples, functions f\ and /2 of two variables (X and Y) are represented by truth
tables in Fig. 4.8a and by K-maps in Fig. 4.8b. Function f\ is shown to have two minterms
and two maxterms while function /2 has three minterms and one maxterm. From the truth
tables the functions can be read in SOP form as
and (4.12)
f 2(X, Y) = T m(0, 2,3) =
However, by combining ("looping out") adjacent minterms these results are immediately
obvious as indicated in Fig. 4.8b.
All that is Y All that is Y
\ Y /~~ \ Y /~~ r- All that is
X Y fi it xN 0 1 / 0 / 1 / NOT X Y = (X+Y)
..•V
S~t I X i /Hf :
. . i
0 0 0 1 ° : 0: •0 1 1 0 n- 0 . o ;•
0 1 1 0 -T-T-
1 0 0 1 1 • o ; 1 1 (^ O
1 1 1 1 ^•••' 2 ^3/ C7I ^ 3
/ /t 1 = Y / /t 2 = X+ Y
All that is NOT Y = Y All that is X
(a) (b)
FIGURE 4.8
(a) Truth tables for functions f\ and fi- (b) K-maps for functions f\ and /2, showing minimum SOP
cover (shaded) and POS cover (dashed loops).