
Page 170 - Engineering Digital Design
P. 170
4.3 INTRODUCTION TO LOGIC FUNCTION GRAPHICS 141
Y /— All that is Z
\ Y Z
x\ oo 01 11 / 10
tf
^f
0 1 1
°1 f°
0 1 3 2 All that is
xl, o 1( oy NOT Z = Z
X Y Z ,1
1 4 5 7
00 0 0 I | /
0 0 1 1
0 1 0 1 All that is
0 1 1 1 NOTYZ = (Y+Z) / /-All that is XZ
1 0 0 Y
1 0 1
1 1 0 All that is Y
1 1 1
a
< > X 1 ~ . .
I^UI ». 's| ?|
t y F O = xz + Y _
2
= (Y+Z)(X+Y)
All that is NOT XY = (X+Y)
(b)
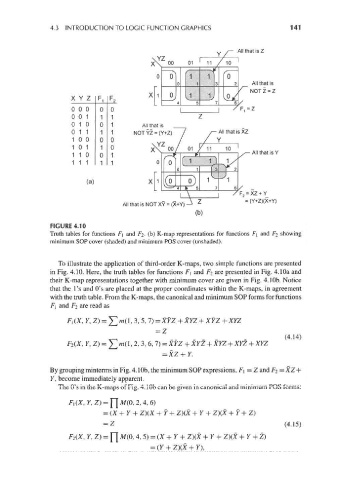
FIGURE 4.10
Truth tables for functions F\ and F 2. (b) K-map representations for functions FI and FI showing
minimum SOP cover (shaded) and minimum POS cover (unshaded).
To illustrate the application of third-order K-maps, two simple functions are presented
in Fig. 4.10. Here, the truth tables for functions FI and F 2 are presented in Fig. 4.10a and
their K-map representations together with minimum cover are given in Fig. 4.1 Ob. Notice
that the 1's and O's are placed at the proper coordinates within the K-maps, in agreement
with the truth table. From the K-maps, the canonical and minimum SOP forms for functions
FI and F 2 are read as
Fj (x, y, z) = ^ m( i, 3,5,7) = xyz + xyz + xfz + xyz
= z
^ _ _ _ (4.14)
F (x, y, z) = 2^m(i, 2,3,6,7)=xyz + xyz + xyz+xyz + xyz
2
=xz + y.
By grouping minterms in Fig. 4. lOb, the minimum SOP expressions, F\=Z and F 2 = XZ +
y, become immediately apparent.
The O's in the K-maps of Fig. 4. lOb can be given in canonical and minimum POS forms:
2
F](X, y, Z) = Y[ M (°' ' 4, 6)
= (x + y + z)(x + y + z)(x + y + z)(x + y + z>
= Z (4.15)
F (x, y, z) = Ff M(0,4,5) = (x + y + zxx + y + zxx + y + z>
2