
Page 169 - Engineering Digital Design
P. 169
140 CHAPTER 4/LOGIC FUNCTION REPRESENTATION AND MINIMIZATION
The same results could have been obtained by reading the maxterms in the K-maps of
Fig. 4.8b. Thus, in maxterm code the canonical and minimum POS forms become
fi = M(0, 2) = (X + Y)(X + F) = Y
and (4.13)
where for f\ the distributive law in Eqs. (3.12) has been applied. Another way of looking
at the results given by Eqs. (4.13) is to read groups of adjacent maxterms. For f\ the two
adjacent maxterms (O's) are read as "all that is NOT ?" or Y = Y . Similarly, for function fa
the 0 in cell 1 is read as "all that is NOT XT" or simply XY = X + Y .
4.3.3 Third-Order K-maps
In dealing with functions of three variables, a suitable graphical representation and K-map
format must be decided. One choice would be to use a three-dimensional graphic having
one axis for each variable. However, such a graphical representation would be difficult to
construct and equally difficult to read. A much better choice would be to maintain the domain
concept in two dimensions. To do this requires the use of two variables for one axis. Shown
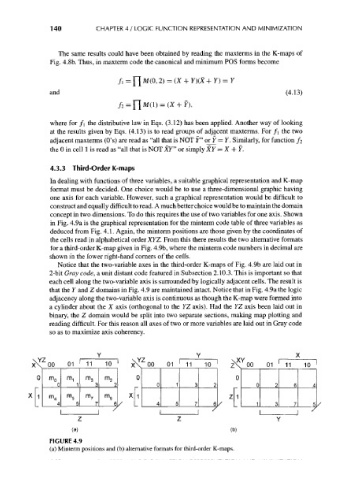
in Fig. 4.9a is the graphical representation for the minterm code table of three variables as
deduced from Fig. 4.1. Again, the minterm positions are those given by the coordinates of
the cells read in alphabetical order XYZ. From this there results the two alternative formats
for a third-order K-map given in Fig. 4.9b, where the minterm code numbers in decimal are
shown in the lower right-hand corners of the cells.
Notice that the two- variable axes in the third-order K-maps of Fig. 4.9b are laid out in
2-bit Gray code, a unit distant code featured in Subsection 2.10.3. This is important so that
each cell along the two- variable axis is surrounded by logically adjacent cells. The result is
that the Y and Z domains in Fig. 4.9 are maintained intact. Notice that in Fig. 4.9a the logic
adjacency along the two- variable axis is continuous as though the K-map were formed into
a cylinder about the X axis (orthogonal to the YZ axis). Had the YZ axis been laid out in
binary, the Z domain would be split into two separate sections, making map plotting and
reading difficult. For this reason all axes of two or more variables are laid out in Gray code
so as to maximize axis coherency.
Y
Z
x^ oo 01 11 10 01 11 10 zN v^ 01 11 10
x^L,
0 m 0 m 1 m 3 rn 2 0 0
0 1 3 2 0 1 3 2 0 2 6 4
X 1 m 7 m 6 X 1 I
m
4 m 5
4 5 7 6 / 4 5 7 w 6 1 3 7 5
/ : : 7
Z Z Y
(a) (b)
FIGURE 4.9
(a) Minterm positions and (b) alternative formats for third-order K-maps.