
Page 446 - Engineering Digital Design
P. 446
416 CHAPTER 9 / PROPAGATION DELAY AND TIMING DEFECTS
(b) Use a timing diagram to show the development of this hazard, similar to the
example in Fig. 9.1c. Then, by adding the hazard cover, show that the hazard is
eliminated following the example in Fig. 9.2c. Assume that the inputs and output
are all active high.
(c) Construct the logic circuit for F SOp and include the hazard cover.
9.4 Map the expression in Problem 9.3 and extract a minimum expression for FPQS- This
function contains a single static 0-hazard.
(a) From this expression (without using a K-map), determine the coupled variable,
coupled terms, the initial and final states of the hazardous transition, and the hazard
cover to be added to the expression. To do this, follow the example in Eq. (9.6).
(b) Use a timing diagram to show the development of this hazard, similar to the
example in Fig. 9.4c. Then by adding the hazard cover, show that the hazard is
eliminated following the example in Fig. 9.5c. Assume that the inputs and output
are all active high.
(c) Construct the logic circuit for FPQS and include the hazard cover.
9.5 Each of the following minimum or reduced functions contains one or more static
hazards. For each function (without using a K-map), determine the coupled variable,
coupled terms, the initial and final states of the hazardous transition, and the hazard
cover to be added.
(a) W = ABCD + BCD+ACD
(b) R = (U + W + X}(U + V + W)(V + X)
(c) G = WXY + XYZ+ WYZ+WY
(d) T = (A + B + C)(A + B+ C)(A + D)(B + D)
(e) Y = wyz + xz + xy
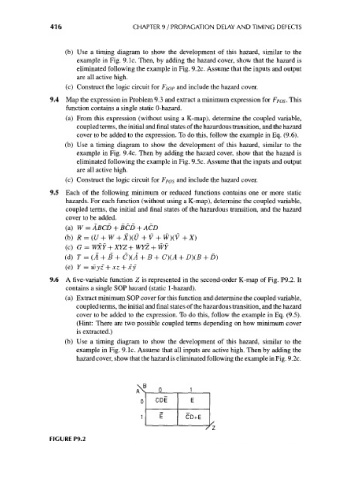
9.6 A five-variable function Z is represented in the second-order K-map of Fig. P9.2. It
contains a single SOP hazard (static 1-hazard).
(a) Extract minimum SOP cover for this function and determine the coupled variable,
coupled terms, the initial and final states of the hazardous transition, and the hazard
cover to be added to the expression. To do this, follow the example in Eq. (9.5).
(Hint: There are two possible coupled terms depending on how minimum cover
is extracted.)
(b) Use a timing diagram to show the development of this hazard, similar to the
example in Fig. 9.1c. Assume that all inputs are active high. Then by adding the
hazard cover, show that the hazard is eliminated following the example in Fig. 9.2c.
CDE E
E CD + E
FIGURE P9.2