
Page 120 - Environmental Control in Petroleum Engineering
P. 120
The Impact of Drilling and Production Operations 107
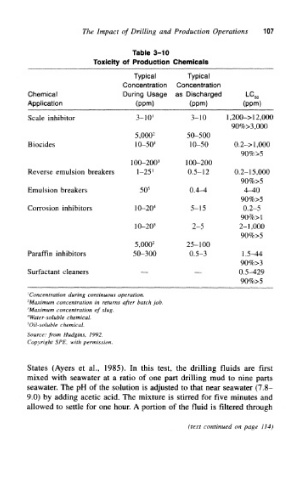
Table 3-10
Toxicity of Production Chemicals
Typical Typical
Concentration Concentration
Chemical During Usage as Discharged LC 50
Application (ppm) (ppm) (ppm)
Scale inhibitor 3-10' 3-10 l,200-> 12,000
90%>3,000
2
5,000 50-500
Biocides 10-50' 10-50 0.2-> 1,000
90%>5
100-200 3 100-200
Reverse emulsion breakers 1-25' 0.5–12 0.2-15,000
90%>5
Emulsion breakers 50 5 0.4–4 4–40
90%>5
Corrosion inhibitors 10-20 4 5-15 0.2-5
90%>1
10–20 5 2–5 *j 2-1,000
,<-.
90%>5
5,000 2 25-100
Paraffin inhibitors 50-300 0.5-3 1.5-44
90%>3
Surfactant cleaners — 0.5-429
—
90%>5
'Concentration during continuous operation.
Maximum concentration in returns after batch job,
3
Maximum concentration of slug.
4
Water-soluble chemical.
5
Oil-s0luble chemical.
Source: from Hudgins, 1992.
Copyright SPE, with permission.
States (Ayers et al., 1985). In this test, the drilling fluids are first
mixed with seawater at a ratio of one part drilling mud to nine parts
seawater. The pH of the solution is adjusted to that near seawater (7.8–
9.0) by adding acetic acid. The mixture is stirred for five minutes and
allowed to settle for one hour. A portion of the fluid is filtered through
(text continued on page 114)