
Page 405 - Excel 2007 Bible
P. 405
25_044039 ch19.qxp 11/21/06 11:10 AM Page 362
Part III
Creating Charts and Graphics
A few chart elements consist of multiple objects. For example, the data labels element consists of one label
for each data point. To more or delete one data label, click once to select the entire element and then click a
second time to select the specific data label. You can then move or delete the single data label.
Formatting chart elements
Many users are content to stick with the predefined chart layouts and chart styles. For more precise cus-
tomizations, Excel allows you to work with individual chart elements and apply additional formatting. You
can use the Ribbon commands for some modifications, but the easiest way to format chart elements is to
right-click the element and choose Format from the shortcut menu. The exact command depends on the
element you select. For example, if you right-click the chart’s title, the shortcut menu command is Format
Chart Title.
The Format command displays a stay-on-top tabbed dialog box with options for the selected element.
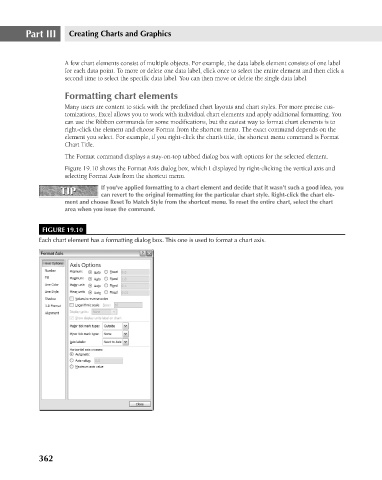
Figure 19.10 shows the Format Axis dialog box, which I displayed by right-clicking the vertical axis and
selecting Format Axis from the shortcut menu.
If you’ve applied formatting to a chart element and decide that it wasn’t such a good idea, you
TIP
TIP
can revert to the original formatting for the particular chart style. Right-click the chart ele-
ment and choose Reset To Match Style from the shortcut menu. To reset the entire chart, select the chart
area when you issue the command.
FIGURE 19.10
Each chart element has a formatting dialog box. This one is used to format a chart axis.
362