
Page 470 - Excel 2007 Bible
P. 470
27_044039 ch21.qxp 11/21/06 11:12 AM Page 427
Visualizing Data Using Conditional Formatting
Using data bars in lieu of a chart
Using the data bars conditional formatting can sometimes serve as a quick alternative to creating a chart.
Figure 21.5 shows a three-column table of data, with data bars applied in the third column. The third col-
umn of the table contains references to the values in the second column. The conditional formatting in the
third column uses the Show Bars Only option.
FIGURE 21.5
This table uses data bars conditional formatting.
Figure 21.6 shows an actual bar chart created from the same data. The bar chart takes about the same 21
amount of time to create and is a lot more flexible. But for a quick and dirty chart, data bars are a good
option — especially when you need to create several such charts.
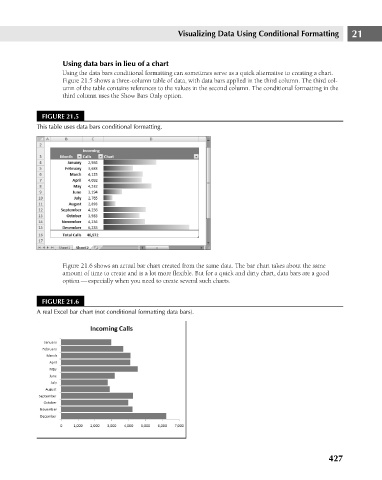
FIGURE 21.6
A real Excel bar chart (not conditional formatting data bars).
427