
Page 472 - Excel 2007 Bible
P. 472
27_044039 ch21.qxp 11/21/06 11:12 AM Page 429
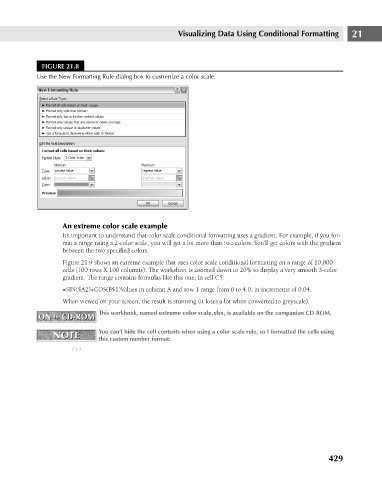
FIGURE 21.8
Use the New Formatting Rule dialog box to customize a color scale.
An extreme color scale example Visualizing Data Using Conditional Formatting 21
It’s important to understand that color scale conditional formatting uses a gradient. For example, if you for-
mat a range using a 2-color scale, you will get a lot more than two colors. You’ll get colors with the gradient
between the two specified colors.
Figure 21.9 shows an extreme example that uses color scale conditional formatting on a range of 10,000
cells (100 rows X 100 columns). The worksheet is zoomed down to 20% to display a very smooth 3-color
gradient. The range contains formulas like this one, in cell C5:
=SIN($A2)+COS(B$1)Values in column A and row 1 range from 0 to 4.0, in increments of 0.04.
When viewed on your screen, the result is stunning (it loses a lot when converted to greyscale).
This workbook, named extreme color scale.xlsx, is available on the companion CD-ROM.
ON the CD-ROM
ON the CD-ROM
NOTE You can’t hide the cell contents when using a color scale rule, so I formatted the cells using
NOTE
this custom number format:
;;;
429