
Page 471 - Excel 2007 Bible
P. 471
27_044039 ch21.qxp 11/21/06 11:12 AM Page 428
Part III
Creating Charts and Graphics
Using color scales
The color scale conditional formatting option varies the background color of a cell based on the cell’s value, rel-
ative to other cells in the range.
A color scale example
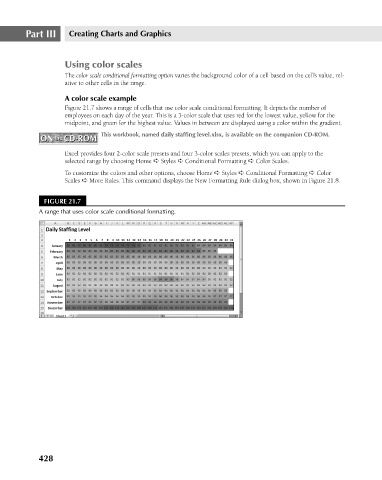
Figure 21.7 shows a range of cells that use color scale conditional formatting. It depicts the number of
employees on each day of the year. This is a 3-color scale that uses red for the lowest value, yellow for the
midpoint, and green for the highest value. Values in between are displayed using a color within the gradient.
ON the CD-ROM
ON the CD-ROM
Excel provides four 2-color scale presets and four 3-color scales presets, which you can apply to the
selected range by choosing Home ➪ Styles ➪ Conditional Formatting ➪ Color Scales.
To customize the colors and other options, choose Home ➪ Styles ➪ Conditional Formatting ➪ Color
Scales ➪ More Rules. This command displays the New Formatting Rule dialog box, shown in Figure 21.8.
FIGURE 21.7 This workbook, named daily staffing level.xlsx, is available on the companion CD-ROM.
A range that uses color scale conditional formatting.
428