
Page 247 - Excel Data Analysis
P. 247
12 537547 Ch11.qxd 3/4/03 12:48 PM Page 233
USING THE ANALYSIS TOOLPACK ADD-INS 11
Excel creates a four-column table containing ranking information
for the specified values, as outlined in the following table
STATISTIC DESCRIPTION
Point The location of the data value within the specified input range. For example, if the
value was originally the third numeric value in the input data, the Point value is 3.
Input Contains the input values sorted based upon the ranking.
Rank The numeric ranking of each value with 1 being the highest ranking value in the list.
Percent A percentage ranking for the input values. The percentage indicates the percentage
of values that are below the specified value.
You can also use the RANK function to create a the RANK function: =RANK(Number, Ref,
formula to rank a specific value within a data list. [Order]). The following table provides a
The RANK function returns a number that shows description of the three arguments for the RANK
how the value compares with other numbers in function.
the data list. You use the following syntax with
ARGUMENT DESCRIPTION
Number The numeric value you want to rank.
Ref The range of cells that you want to use to rank the specified value.
Order A numeric value specifying the sort order for the list. If you omit the value, or
the value is 0, Excel sorts the list in descending order. If the argument is any other
value, Excel sorts in ascending order. The order argument is optional.
$B$1:$B$12
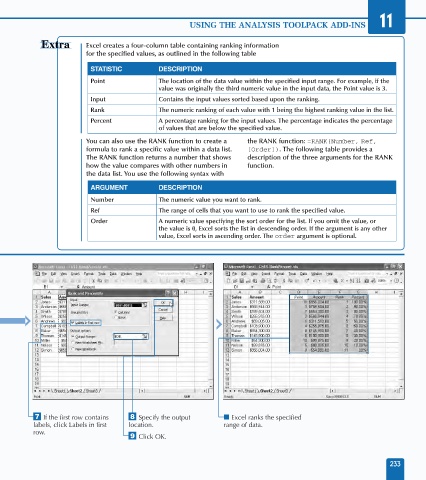
‡ If the first row contains ° Specify the output ■ Excel ranks the specified
labels, click Labels in first location. range of data.
row.
· Click OK.
233